


.png)
Most trading strategies look convincing until you test them. A setup might work on a few charts and align with your existing bias. For many traders, this sense of repeatability is enough to start risking capital.
Losses often occur because the initial idea lacked proper validation. Backtesting identifies whether a set of rules has ever worked in the past. It does not guarantee future performance.
The real gap becomes clear through documentation. Backtesting shows whether your rules have an edge. Journaling shows whether you actually trade them that way. Without this combination, trading remains a series of ideas that rarely survive contact with real market conditions.
Backtesting shows how your trading rules would have handled historical price action. Its primary value lies in identifying structural weaknesses before you put money at risk. The process reveals performance during drawdowns, signal frequency, and whether your success comes from a reliable edge or a few lucky trades.
This tool has specific limitations. It cannot account for future regime shifts, market panics, or the gap between historical data and live execution.
The most practical use for backtesting is as a stress test. Focus on identifying potential for loss and defining your worst-case scenario. Looking only at maximum profit provides an incomplete picture of risk.
Pro Tip: Always verify your data source and check that it includes periods of genuine market stress.
Many traders struggle when their ideas never evolve into specific rules. A functional strategy requires a system you can execute consistently under pressure. Identifying a pattern on a chart is only the first step.
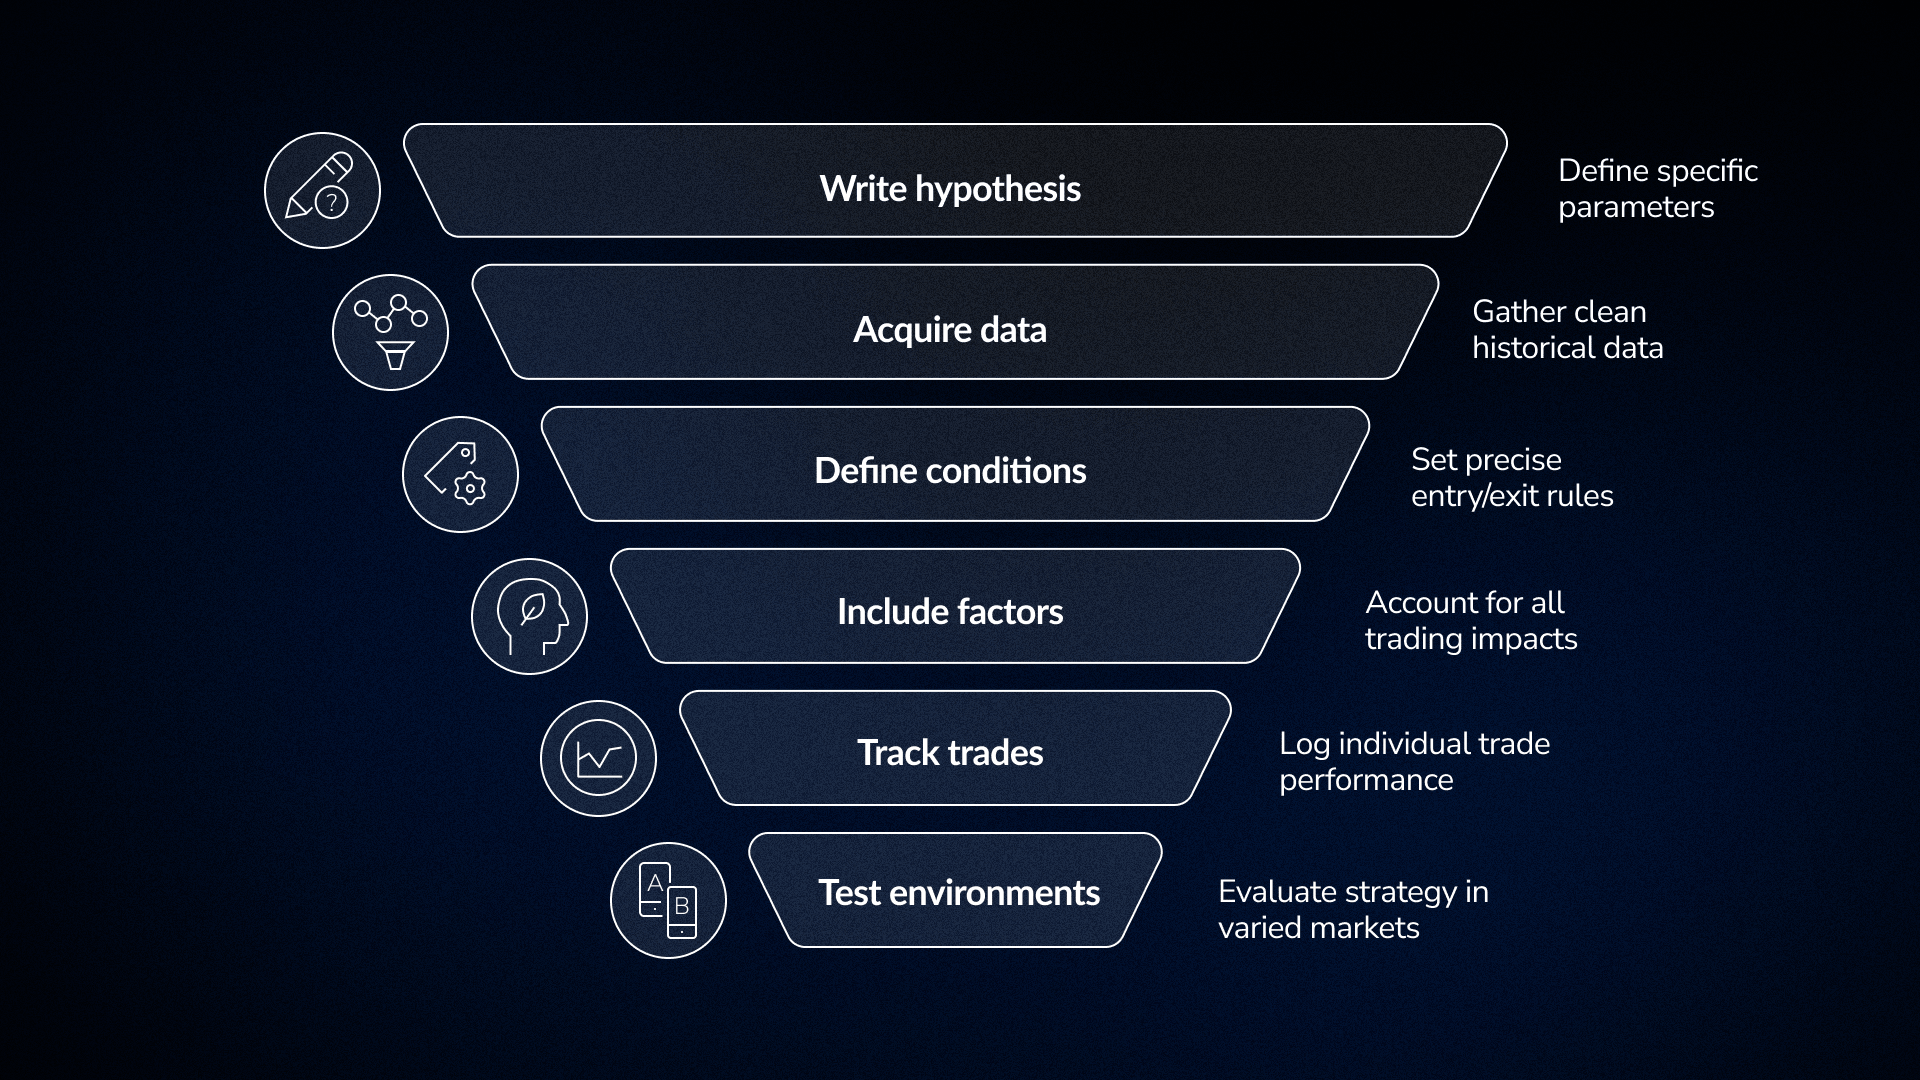
Moving from an instinct to a concrete rule requires a structured framework. This level of detail is necessary for building a reliable system.
Avoid vague ideas like "momentum works" and focus on specific parameters. For example, define an entry as a price close above the 50-day moving average with double the typical volume.
Quality data is the foundation of any test. If your dataset has gaps or missing price points, the final results will be unreliable.
Rules need to be objective. If a rule is clear, two different traders looking at the same chart should identify the same setups.
Your rules should account for everything that affects a live account. This means defining your stop losses, profit targets, and position sizes from the start.
Log each trade instead of just looking at the final balance. Total profit figures often hide important details about how a strategy actually behaves under pressure.
A strategy is only as good as the conditions it can survive. If a system only worked during a specific bull market, its long-term viability is questionable.
Inside FX Replay, you can move through historical data one candle at a time. This approach lets you execute trades as the market develops. You can jump to a specific date to test how your system handles different conditions, such as high volatility or a ranging market. This turns backtesting into an active experience instead of a simple statistical summary.
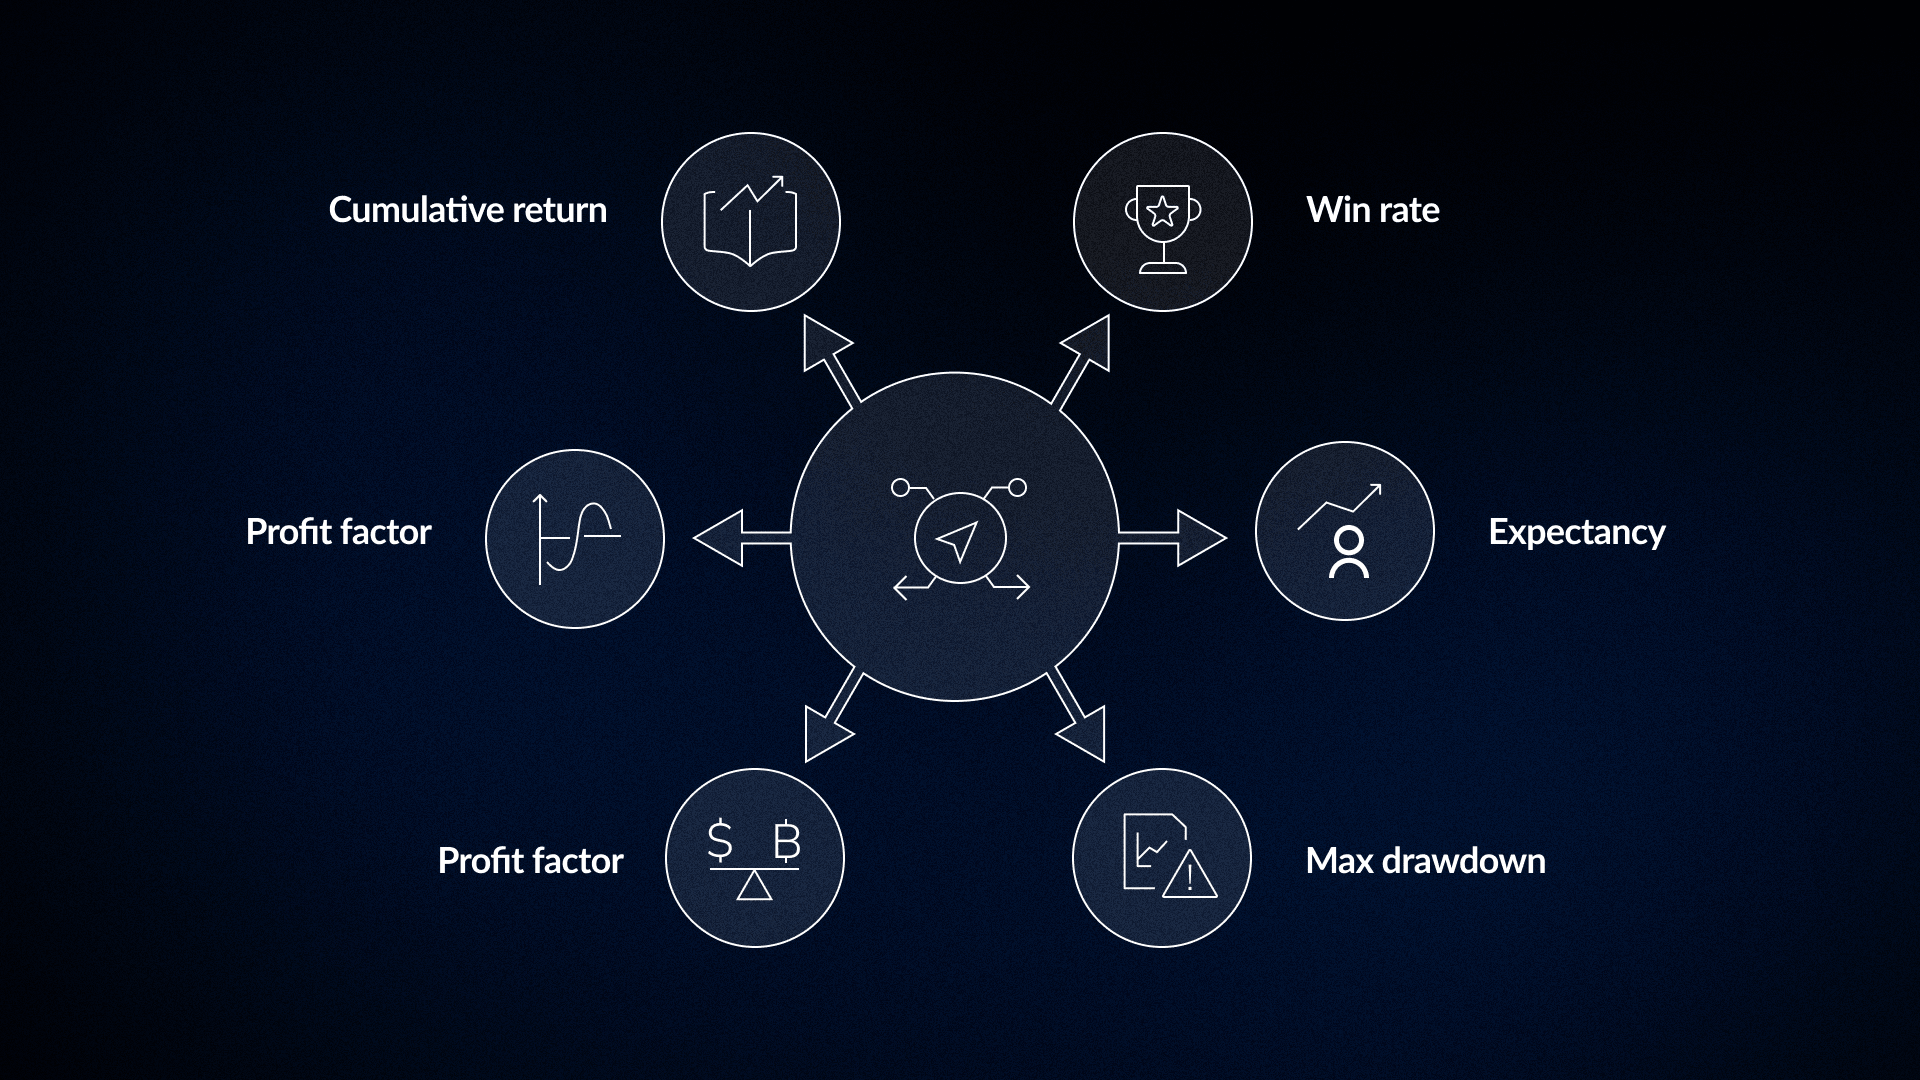
Most traders focus on win rate because it feels intuitive. This single number is often the least informative metric for evaluating a strategy.
A system with a 70% win rate that loses three times what it wins will eventually drain an account. A system with a 40% win rate and a 3:1 reward-to-risk ratio is consistently profitable. Combining these factors gives you expectancy.
This measures the percentage of profitable trades. It becomes meaningful only when compared to the size of your average win and loss.
This shows the average profit per trade over a full sample. It requires a significant number of trades to provide an accurate view.
This identifies the largest peak-to-trough decline in your data. It should be treated as a realistic possibility rather than just a historical floor.
Divide gross profit by gross loss to find this number. A value above 1.5 generally suggests a good strategy.
This calculates return per unit of volatility. Results can be skewed by low-volatility periods that might not reflect live conditions.
This is the total growth of your capital. It often hides internal volatility and severe drawdown periods.
Pro Tip: Determine if your account and your mindset can handle the historical maximum drawdown before you go live. If the honest answer is no, the strategy is unsuitable regardless of its total return.
Backtesting proves the viability of your rules. Journaling reveals whether you actually follow them. It documents what happens when you deviate from your plan and makes your behavioral patterns visible. Without a journal, most traders repeat the same mistakes across different strategies while blaming market conditions for their results.
Minimum fields for a useful trade journal:
Many traders skip the emotional state and rule deviation fields. These are often the most informative parts of a journal.
The most significant insights from journaling rarely involve market behavior. Instead, they highlight how you react under pressure. This includes your behavior when a position moves against you or when news creates uncertainty. These patterns repeat with more consistency than most traders realize until they review 50 or 100 trades.
Pro Tip: Check your rule deviation column before looking at your profit and loss after a losing session. If deviations cluster around your losses, the issue is behavioral. Changing your strategy will not fix a failure to follow the rules.
Standard backtesting guides rarely discuss using a trade journal as a dataset for testing rule modifications. Traditional chart-based testing evaluates a theoretical strategy in a vacuum. It assumes perfect execution and zero emotional hesitation.
Journal-based testing evaluates rule changes against your actual historical performance, accounting for late entries, emotional exits, and real-world execution errors already in your records.
This approach differs from hypothetical simulation. Applying a new filter to your journal data shows whether that change would have improved your actual results rather than a theoretical model.
Requirements for Meaningful Journal Analysis
Pattern detection requires at least 100 trades. Anything below this threshold risks mistaking random variance for strategy performance. Structuring your journal data correctly transforms a simple record of outcomes into a usable backtesting dataset.
The FX Replay journal integrates directly with the sessions where trades occur. Every entry connects to a specific chart moment and includes tags for setup types and behavioral notes. This data flows into an analytics dashboard for immediate review. If you want to see if avoiding afternoon trades would change your expectancy, the tag filters surface that information instantly.
Pro Tip: Use consistent setup tags for every trade starting with your first session. The specificity of your tags determines how useful your journal becomes for future testing. "Breakout" is a starting point, but "4H breakout above consolidation resistance with high volume" provides a category you can actually test.
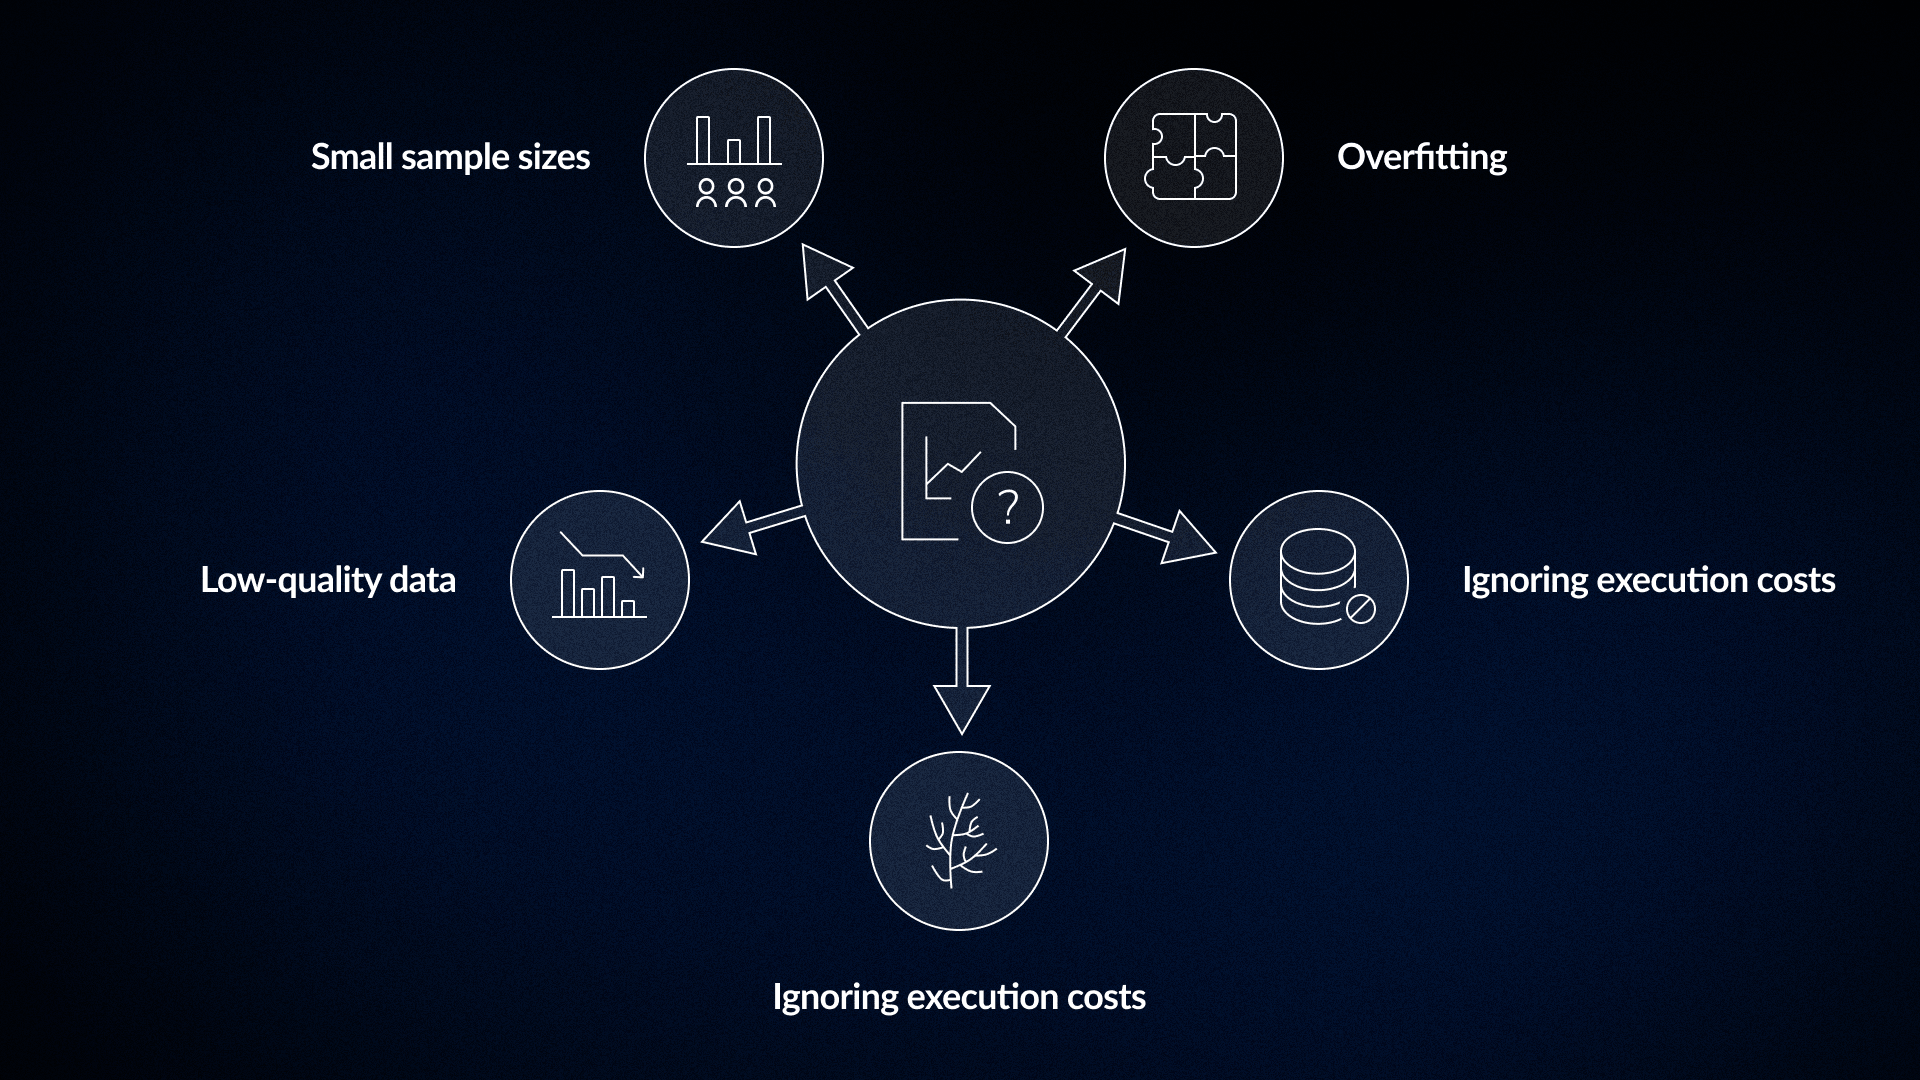
Backtesting is a powerful tool, but it is easy to misuse. Most unreliable results stem from a few consistent errors that artificially inflate performance figures.
Tuning a strategy until it fits a specific historical period perfectly often leads to failure on new data. A system optimized only for the conditions between 2018 and 2022 likely reflects the quirks of those years rather than a genuine edge. Validating a strategy requires testing unchanged rules on an out-of-sample period that was not used during development.
Paper profits often disappear once you account for commissions and slippage. A strategy with a small average profit per trade might be profitable in theory but net-negative after realistic round-trip costs. These costs must be included in every test.
Testing only on assets that exist today ignores those that were delisted or went to zero. This creates an optimistic bias that overstates historical performance. Reliable testing requires data that includes failed or delisted assets.
Price gaps, unadjusted splits, and missing periods distort your results. These errors usually make a strategy look better than it actually is. The quality of your data sets the ceiling for the accuracy of your test.
Random variance dominates results in samples of fewer than 100 trades. A 30-trade test with a high win rate does not prove a strategy has a long-term edge.
Market conditions are often the primary factor in whether a strategy succeeds or fails. Most systems have a preferred regime where they perform best.
Applying a breakout system during a period of low-volatility chop will produce frequent false signals. Your backtest needs to include the specific conditions you expect to encounter in live trading.
Pro Tip: Segment your backtest results by market condition instead of just by date. If a strategy wins 62% of the time in trending markets but only 31% in ranges, it is not uniformly profitable. This data tells you exactly when the strategy should be active and when it should stay on the sidelines.
The idea that a strategy is simply discovered and then used is a common trading myth. Effective systems must adapt through constant iteration or they will become obsolete as market conditions change.
A trade journal identifies exactly where your live execution differs from your backtest. It reveals why specific rules failed under real market conditions and shows which adjustments are based on observed behavior rather than theory.
Long-term success depends on your ability to iterate. Profitable traders build their systems through multiple cycles of testing and refinement.
FX Replay integrates session replay and journaling to shorten this feedback loop. You can test your rules through historical sessions, tag each trade with behavioral context, and review analytics by tag. This allows you to adjust and retest within the same platform, making the entire process faster.
Pro Tip: Document the specific reasons for every change to your system. Understanding why you adjusted a rule helps prevent the same mistakes from reappearing later under a different name.
The question of sample size is fundamental to trading. While answers vary, the logic behind a reliable dataset is straightforward.
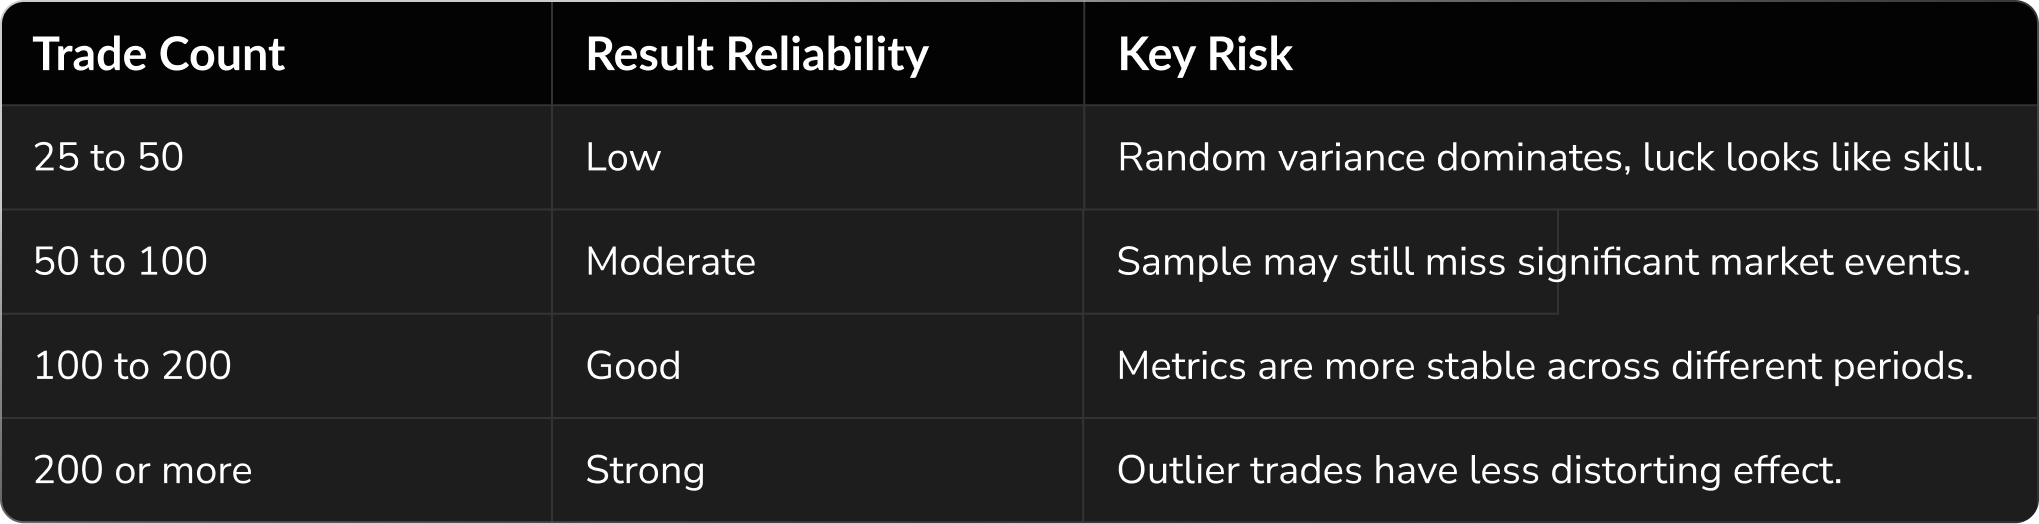
A high win rate over a small sample often reflects a lucky streak. Once you reach 200 trades across multiple market environments, the data begins to represent the strategy itself.
If a system produces fewer than 100 signals over several years, the timeframe may be too long for effective learning. The setup might also be too rare to build statistical confidence. These factors should be understood before you put money behind a strategy.
Pro Tip: Calculate your expected trade frequency per month. If a strategy generates only two or three signals, it will take years to reach a meaningful sample size. Consider whether this timeline fits your goals before committing capital.
Process quality separates successful traders from those who constantly switch strategies. Use this checklist to ensure your system is ready for live markets.
Backtesting does not eliminate market uncertainty. Price action remains unpredictable because environments shift and regimes change. Using historical data identifies avoidable errors before you put capital at risk.
Journaling provides the context needed to evaluate your trades. It helps you distinguish between a failing strategy and poor execution. Improving your process is a more effective way to achieve consistency. Focusing on these operational details leads to better performance over time.
If you want to know whether your strategy has a real edge, test it.
Run it through different market conditions. Track how you actually execute it.
Start your backtesting journey now.
Couldn't find your question here?
Go check out our Help Center below!
Backtesting confirms if your rules generated a positive expectancy in the past. It shows historical viability under specific parameters. It cannot guarantee future results.
A minimum of 100 trades is necessary to identify a reliable pattern. Random variance often distorts the data in smaller samples. Reaching 200 trades across varied market environments provides much more credible conclusions.
These logs serve different purposes. Backtesting journals help you confirm that your rules are consistent and objective. Live journals capture behavioral data and execution errors that historical testing cannot replicate.
Misleading results often come from overfitting rules to a specific time period or ignoring commissions and slippage. Other common errors include using incomplete data, failing to account for delisted assets, and relying on small sample sizes.
Review your strategy after completing a significant block of live trades. Regular journaling provides the data necessary to make objective improvements instead of reacting to short-term losses.
.png)
.png)


