


.png)
There's a version of backtesting that takes 40 hours to produce 100 trades, leaves you more confused than when you started, and ends with you abandoning the process entirely.
Most traders are doing that version.
Then there's a version that takes five focused 90-minute sessions, produces clean statistical data across multiple market conditions, and tells you with confidence whether your strategy has a real edge, or doesn't.
The difference isn't talent or tools. It's process.
This guide breaks down exactly how to compress your backtesting timeline without sacrificing data quality — so you can find your edge faster and start building confidence before you ever risk real capital.
Before optimizing your backtesting speed, it's worth understanding why it's slow in the first place.
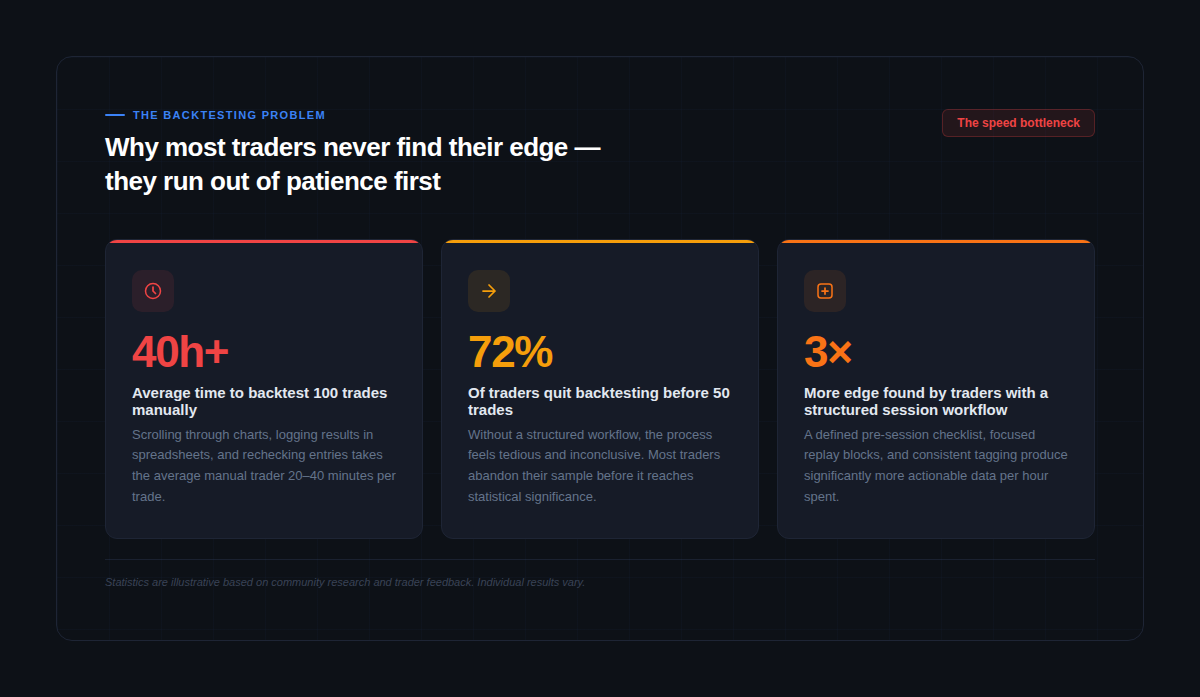
The most common time sinks aren't where traders think they are. It's rarely the replay itself that kills momentum. It's the three bottlenecks that surround it:
Bottleneck 1: Undefined rules
When your entry criteria are vague, you spend 5–10 minutes per trade debating whether a setup qualifies. Multiply that by 100 trades and you've lost nearly a full working week to indecision. The fix isn't faster replay, it's defining your rules so precisely that every decision takes under 30 seconds.
Bottleneck 2: No session structure
Most traders open a chart, start scrolling, and stop whenever they feel tired or frustrated. Without defined session boundaries, a start time, a trade count target, a specific market condition to test, sessions bleed together and produce mixed, uninterpretable data.
Bottleneck 3: Logging while replaying
Switching between replay and a spreadsheet mid-session is the single biggest speed killer. Every time you break focus to log a trade, you lose the psychological continuity that makes market replay valuable. Use a tool with integrated journaling, or batch your logging to immediately after each trade, never during.
Fix these three bottlenecks and you'll cut your backtesting time by more than half without changing anything else.
The goal isn't to rush your backtesting. It's to eliminate the dead time between trades, the pausing, second-guessing, and mid-session setup that turns a 90-minute process into a four-hour one.
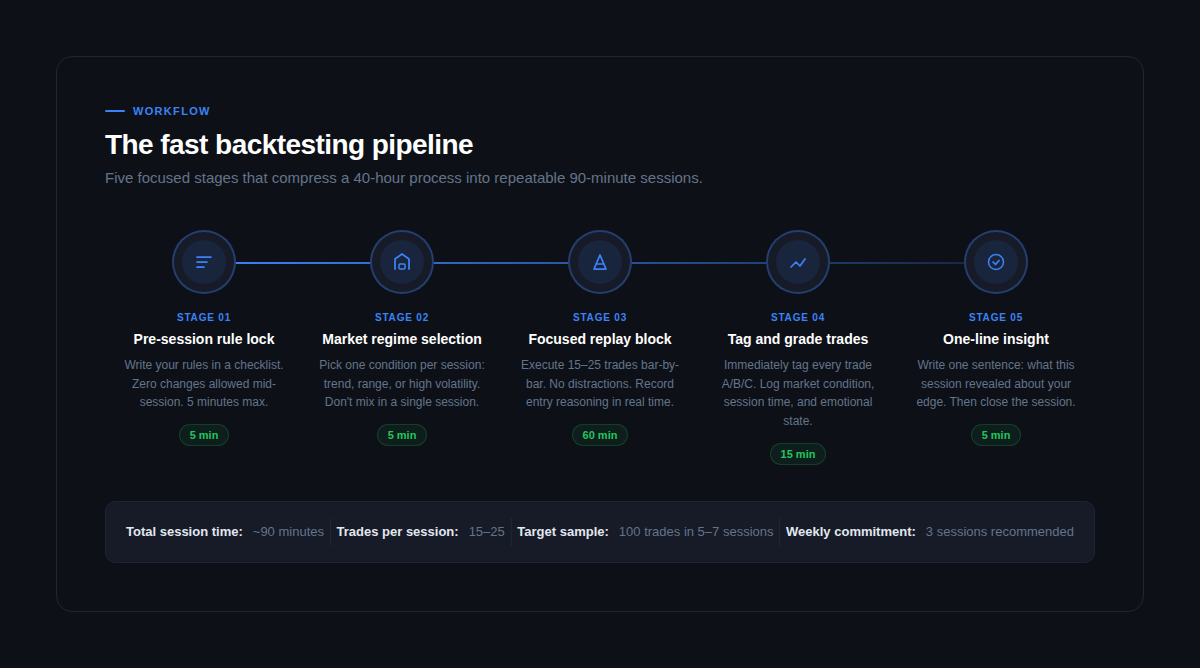
Here's how to structure every session:
Stage 1: Pre-session rule lock (5 minutes)
Open your strategy rules document. Read every rule. If anything is ambiguous, resolve it now, not mid-replay. The absolute worst time to change a rule is while you're looking at a setup that the old rule would have excluded. Write your rules, commit to them, and don't touch them until after the session ends.
Stage 2: Market regime selection (5 minutes)
Choose one market condition to test in this session: trending, ranging, or high volatility. Select a date range that clearly fits that condition. This isn't just organizational discipline, it's what makes your data meaningful. Mixing market conditions in a single session produces statistics that can't tell you anything actionable.
Stage 3: Focused replay block (60 minutes)
Execute 15–25 trades bar by bar. No distractions, no skipping forward, no checking the outcome before placing the trade. Record your entry reasoning in one sentence per trade as you go, this takes three seconds and is invaluable for post-session analysis. Treat every session as a prop firm challenge attempt: same rules, same discipline, same emotional accountability.
Stage 4: Tag and grade trades (15 minutes)
Immediately after the replay ends, grade every trade: A (fully rule-compliant), B (minor deviation from rules), C (impulsive or emotional). Log the outcome, the exact R multiple, the market condition, and your one-line entry reason. Don't wait until tomorrow, memory of your decision-making fades within hours.
Stage 5: One-line insight (5 minutes)
Write one sentence summarizing what this session revealed. Not a paragraph, not a list, one sentence. This forces you to synthesize rather than just record. Examples: "Breakout entries in ranging conditions produced -0.4R expectancy, avoid." or "Trend pullbacks at the 15m 50 EMA had a 68% win rate across 22 trades." This single habit builds the pattern recognition that turns raw data into actual edge.
The fastest sessions are the ones that require zero decision-making once the replay starts. Everything gets decided beforehand. Everything.
Work through this before every session:
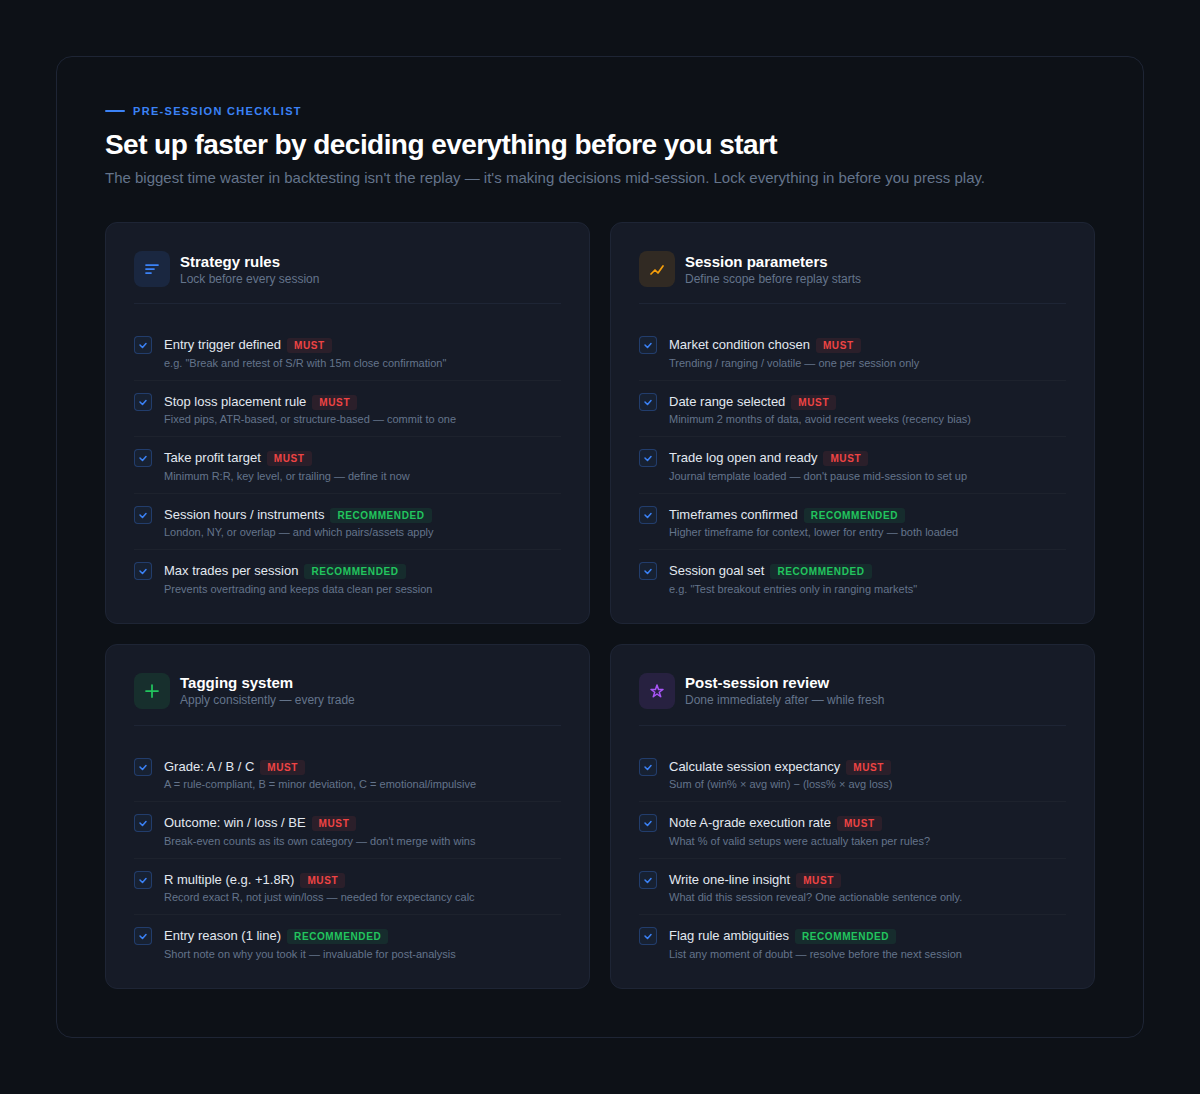
Strategy rules (must be locked before replay)
Write your entry trigger in a single sentence with no room for interpretation. "A break and retest of a 4-hour support level with a 15-minute candle close above" is a rule. "A clean breakout" is not. Define your stop loss placement method,m fixed pips, ATR-based, or structure-based, and commit to one before you start. Set your take profit target: a fixed R ratio, a key level, or a trailing method. Pick one and don't change it mid-session.
Session parameters (set scope before pressing play)
Specify the exact market condition you're testing, trending, ranging, or high volatility, and stick to it. Choose a date range that clearly fits that condition, avoiding the most recent weeks to reduce recency bias. Have your trade journal open and loaded before you start replay. Switching windows mid-session destroys your focus and slows everything down.
Tagging system (applied to every single trade)
The minimum viable tagging system is: grade (A/B/C), outcome (win/loss/break-even), and exact R multiple. That's it. Three data points per trade, applied immediately after each trade closes. More tags are helpful but optional — the three above are what you need to calculate expectancy and execution rate, which are the two most important numbers in your entire backtesting process.
This is where most backtesting processes fail silently.
A strategy tested only in trending markets looks phenomenal. Put it live during a ranging period, which makes up roughly 45% of market time, and it bleeds. The strategy wasn't bad. The testing was incomplete.
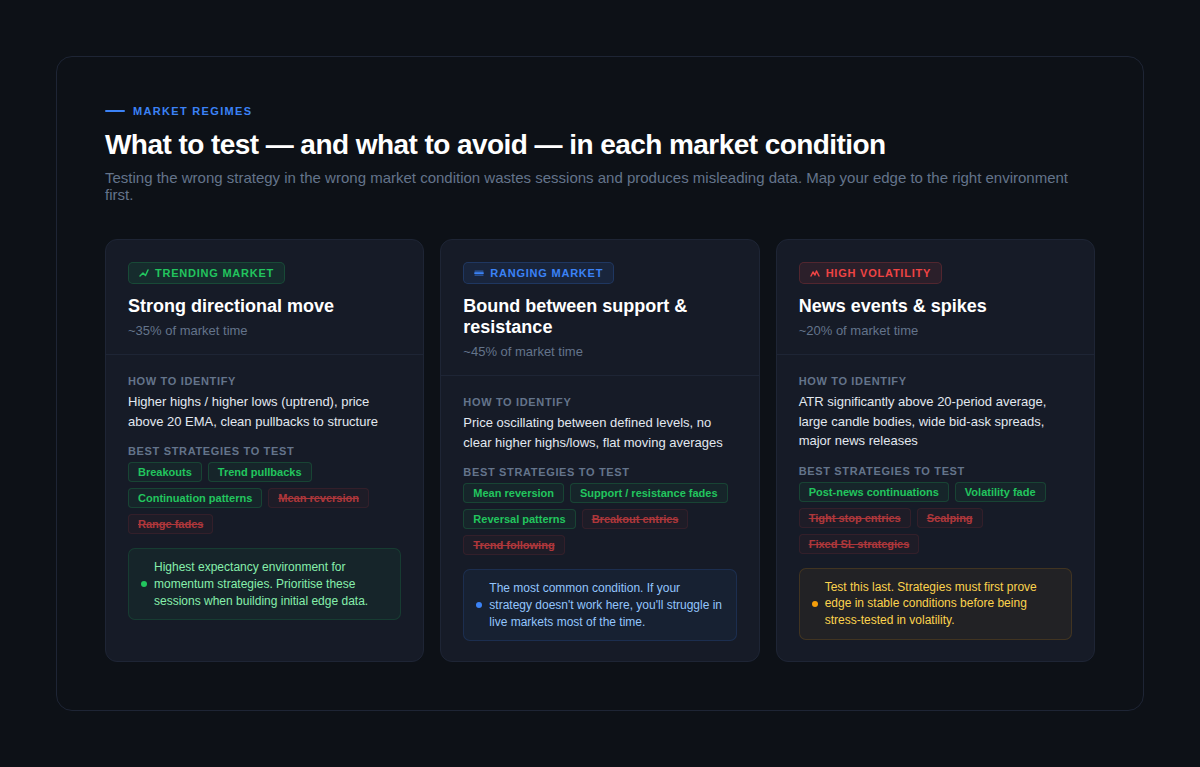
Your edge isn't real until it's been tested across all three major market conditions:
Trending markets (~35% of market time)
The easiest condition to find edge in, and therefore the most dangerous to over-test. Momentum strategies, trend pullbacks, and continuation patterns perform best here. Mean reversion strategies and range fades will mislead you — they produce losses in trends that look like strategy failure when they're actually condition mismatch. Start with trending sessions to get initial data, but don't stop there.
Ranging markets (~45% of market time)
The most important condition to test because it's the most common one. If your strategy doesn't hold up in ranges, it will fail in live markets more than half the time. Reversal setups, support and resistance fades, and mean reversion strategies tend to perform well. Breakout strategies will produce false signals. Identifying whether you're in a range before entering is a skill that only develops through deliberate practice — backtesting in ranging conditions builds exactly that.
High volatility periods (~20% of market time)
News events, data releases, and market dislocations. Test this condition last, after your strategy has proven edge in stable markets. Tight stop losses get wiped out, spreads widen, and price moves in ways that don't reflect normal market behavior. Testing here reveals whether your risk management survives the worst conditions — which is exactly what prop firm challenges are designed to expose.
A complete backtesting sample of 100+ trades should include representation across all three conditions. If your data is 90% trending markets, your statistics are telling you a story about one market condition, not about your strategy's actual edge.
This is the question most backtesting guides don't answer clearly enough.
Edge isn't a feeling. It isn't a winning streak in your replay sessions. It's a specific combination of statistics that hold up across a meaningful sample size and multiple market conditions.
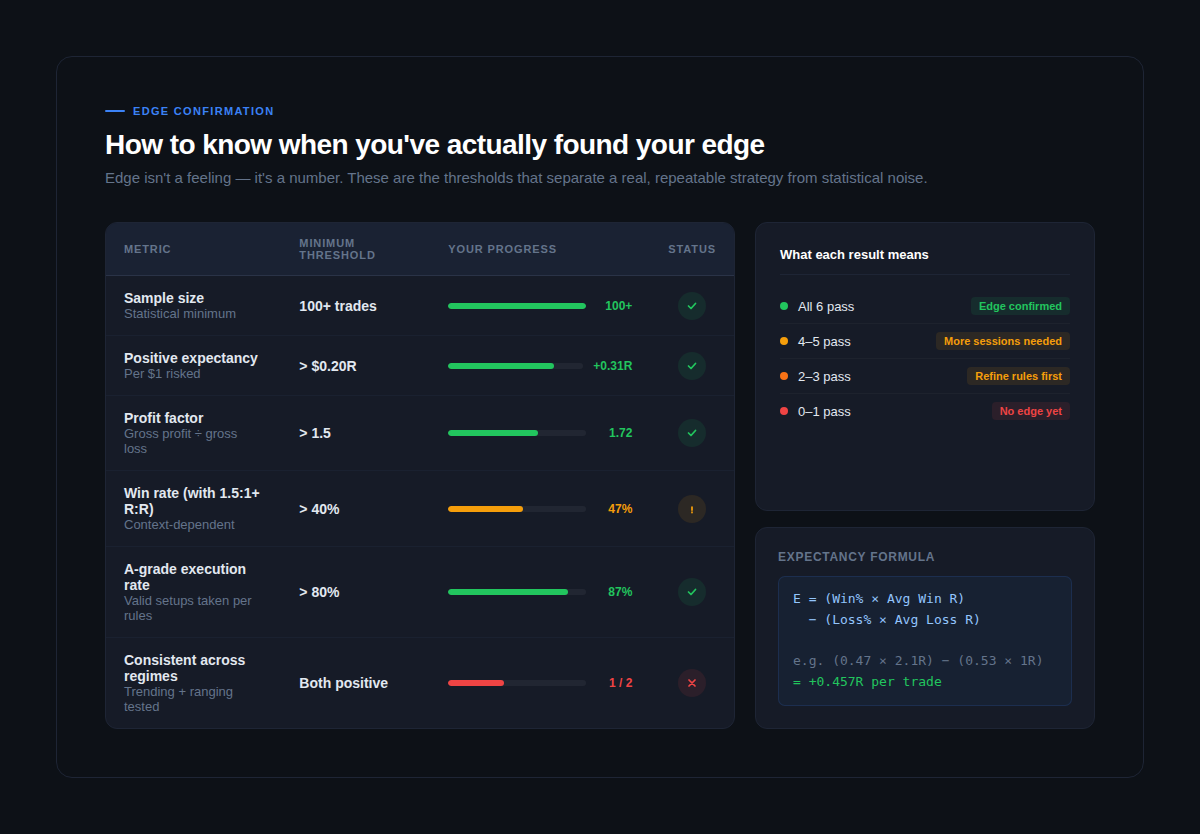
Run through this scorecard after every completed 100-trade sample:
Sample size: 100+ trades
Anything under 100 trades is anecdote, not data. The mathematics of trading edge require a minimum sample to smooth out variance. 200–300 trades across multiple market conditions is genuinely better. Don't make strategy decisions based on 30 or 40 trades, you'll be reacting to noise.
Positive expectancy: greater than +0.20R per trade
Expectancy is calculated as: (win rate × average winning R) minus (loss rate × average losing R). This single number tells you whether your strategy makes money on average across all trades. A positive expectancy above 0.20R per $1 risked is the baseline for a tradeable edge. Above 0.30R is strong. Above 0.50R is exceptional and worth scrutinizing, either your rules are very good or your sample is too favorable.
Profit factor: greater than 1.5
Divide gross profit by gross loss. A profit factor above 1.5 means your strategy makes $1.50 for every $1 lost. Below 1.2 and the strategy is marginal, transaction costs and execution slippage will erode it in live conditions.
A-grade execution rate: greater than 80%
This is the number most traders ignore, and it's the one that reveals the gap between theoretical strategy performance and what you'll actually capture in live trading. If you're only taking 60% of your valid A-grade setups, your live win rate will be lower than your backtested win rate, not because the strategy is worse, but because hesitation and emotional decision-making are costing you setups.
Consistent across market regimes
Run your metrics separately for trending sessions and ranging sessions. Both need to show positive expectancy. If your strategy only works in one condition, you don't have an edge, you have a condition-specific setup that requires you to correctly identify the market regime before every trade. That's a much harder skill.
When all five criteria are met, you have confirmed edge. When some are failing, your backtesting data is telling you exactly where to look.
Once you have the workflow above, there are genuine ways to accelerate without compromising data quality.
Shortcuts that work:
Use a purpose-built replay tool. The difference between a dedicated market replay platform like FX Replay and manually scrolling charts isn't just convenience, it's the integrated journaling, the ability to set prop firm parameters, and the tick-accurate data that makes every session genuinely comparable. Context-switching between replay and a spreadsheet adds 30–40% to your session time.
Run parallel regime sessions. Once your process is solid, run three short sessions in a week, one trending, one ranging, one high volatility, rather than one long undifferentiated session. You'll reach 100 trades faster and the data will be significantly more useful.
Use session goals, not just trade targets. "I'll do 20 trades today" is a weak goal. "I'll test breakout entries in a ranging EUR/USD environment from Q3 last year and measure expectancy by session time" is a goal that produces actionable data. The more specific your session goal, the faster you'll accumulate meaningful pattern data.
Shortcuts that don't work:
Automated backtesting for manual strategies. Automated backtesting can't replicate the decision-making pressure, the hesitation, or the FOMO that affects your live execution. A strategy that back-tests perfectly with an algorithm may perform very differently when you're the one executing it under live conditions. For manual traders, only manual market replay produces transferable data.
Adjusting rules mid-session. Every time you tweak a rule while looking at a loss that the old rule would have avoided, you're curve-fitting in real time. The result is a strategy that works on the data you just tested and nowhere else. Rules change only between samples, never during them.
Stopping at the first successful sample. One favorable 100-trade stretch is not confirmed edge. Test across at least two separate time periods and two separate instruments before committing. If the edge disappears when you change the date range, it was never really there, you found a good stretch of market, not a repeatable strategy.
Speed in backtesting doesn't come from rushing the replay. It comes from eliminating everything that doesn't need to happen, the mid-session rule debates, the ambiguous setups, the context switching, the unstructured sessions with no defined goal.
Follow the five-stage pipeline. Use the pre-session checklist. Test across all three market conditions. Run your edge scorecard after every 100-trade sample.
Done consistently, this process gets you to a statistically meaningful sample in five to seven 90-minute sessions, and to genuine edge confirmation in two to three weeks of regular practice.
The traders who find their edge fastest aren't the ones with the most screen time. They're the ones with the most structured screen time.
Ready to run faster sessions with integrated journaling and tick-accurate replay data? Start backtesting with FX Replay →
Couldn't find your question here?
Go check out our Help Center below!
One hundred trades is the minimum threshold before any statistical conclusions are reliable. Below that number, variance dominates and your results reflect luck more than edge. For serious strategy validation — particularly before a prop firm challenge — aim for 200–300 trades across at least two separate time periods. The sample size question isn't just about statistical confidence; it's about testing enough market variety that your results aren't tied to one favorable stretch of price action.
Start with one instrument until you've confirmed edge, then expand to a second to validate robustness. Testing across too many instruments too early dilutes your data and makes it harder to identify condition-specific patterns. Once you have 100+ trades on one pair showing positive expectancy, run the same strategy on a correlated instrument (e.g. GBP/USD if you tested EUR/USD) to see whether the edge transfers.
Three quick checks: price structure (higher highs and lows = trend, oscillating between levels = range), the relationship between price and the 20-period EMA (above and pulling away = trend, crossing back and forth = range), and ATR relative to its recent average (significantly elevated = high volatility). Pick date ranges where the condition is unambiguous — the cleaner your regime selection, the more useful your data.
Technically yes, but your results will be compromised by familiarity bias — you'll unconsciously avoid setups that you remember failing and favour ones you remember working. The best practice is to test on periods you haven't studied recently, or to use a replay tool that prevents you from seeing the outcome before placing your trade. FX Replay's bar-by-bar replay enforces this discipline automatically.
Ninety minutes is the optimal session length for most traders. Beyond 90 minutes, decision fatigue begins to affect your execution quality and the data you produce is no longer representative of how you trade when fresh. Three focused 90-minute sessions per week will get you to a 100-trade sample in under two weeks, significantly faster than occasional multi-hour sessions that burn out before reaching meaningful data.
.png)
.png)


