


.png)
Even well-built trading strategies degrade 10 to 20% when moving from backtest to live. You already know this number exists. You've seen it in passing, heard it mentioned in trading communities, maybe even read about it in some backtesting guide.
But here's what nobody really explains: that 10–20% isn't random. It's not luck and it’s certainly not a sign your strategy is broken.
It's predictable and if you understand where it comes from, you can actually account for it before you risk real capital.
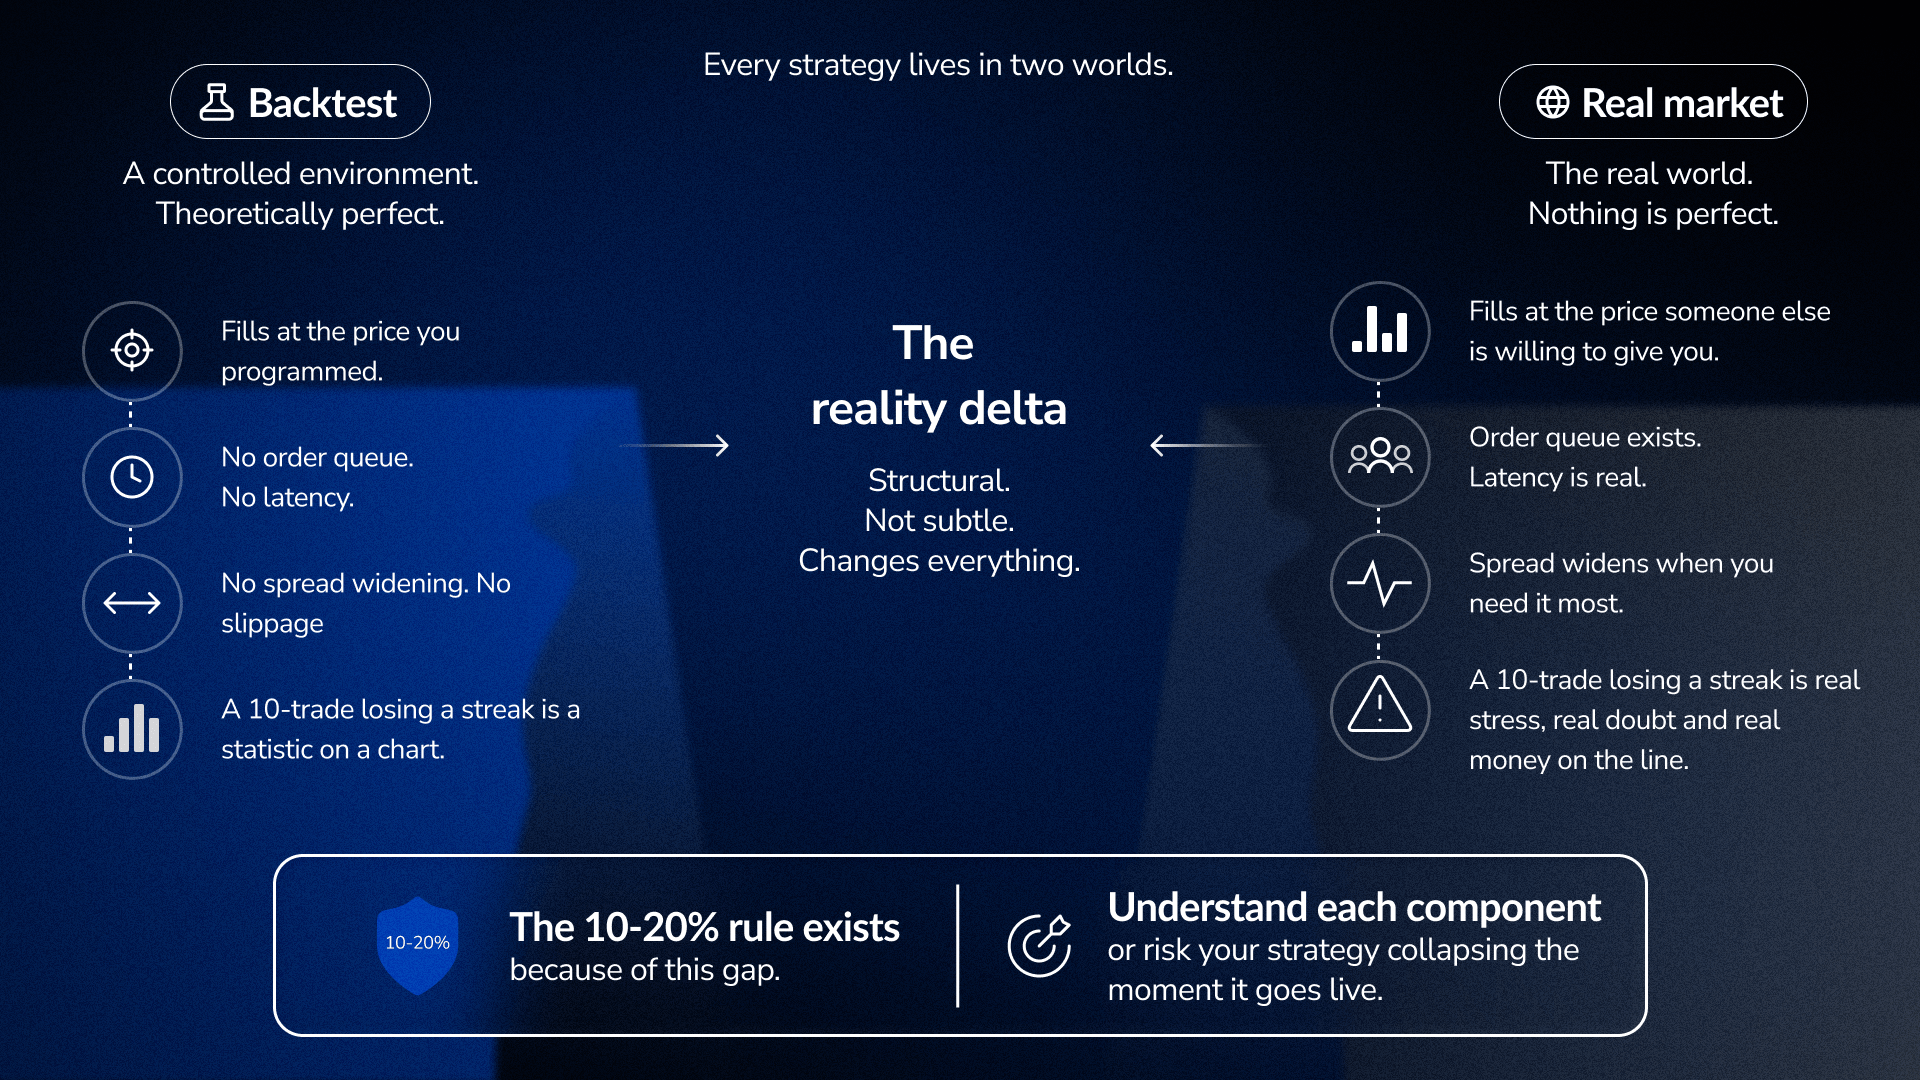
Every strategy lives in two worlds.
First, it lives in a controlled environment, your backtest, where conditions are theoretically perfect. Then it lives in the real market, where nothing about those perfect conditions actually exists.
The difference isn't subtle, but structural.
In a backtest, fills happen at whatever price you programmed them to happen at. In live trading, fills happen at the price someone else is willing to give you, which is often worse, and sometimes dramatically worse.
In a backtest, there's no order queue, no latency, no spread that widens exactly when you need it to tighten. In live trading, all of these exist simultaneously.
However, the most important difference is psychological.
A 10-trade losing streak in a backtest is a statistic you observe on a chart. A 10-trade losing streak in a live account is ten decisions made in the presence of real stress, real money moving in the wrong direction, real doubt about whether you made a mistake. Your body doesn't differentiate between financial loss and physical threat and the stress response is identical. That changes everything about how you execute the next trade.
This is why the 10–20% rule exists and why understanding each component of it is the difference between a strategy that survives the transition and one that collapses within weeks.
Pull up any strategy backtest. Look at the average winning trade. Let's say it's $30.
Now ask: how much of that $30 actually ends up in your account?
For most traders, the honest answer is a lot less. The backtest will never tell you this unless you deliberately force it to.
Here's what a realistic cost structure looks like:
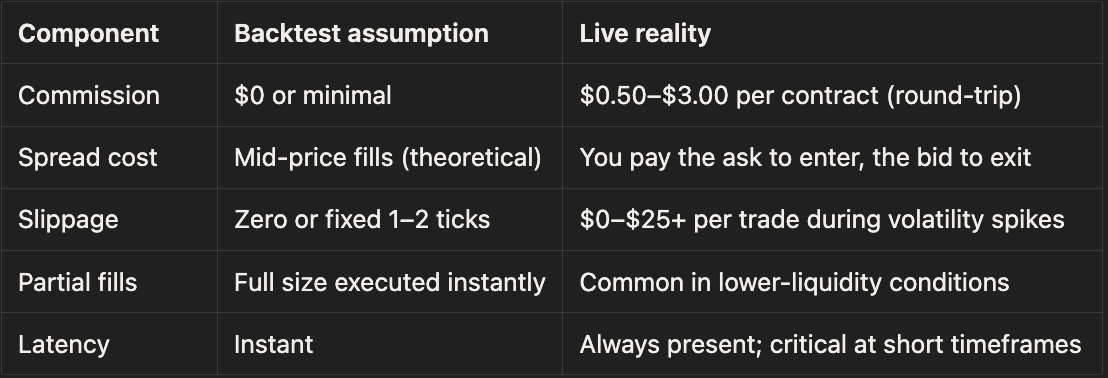
The slippage line is where most backtests completely disconnect from reality.
During normal market hours, slippage is minor, maybe a tick or two. However, during news events, earnings releases, or liquidity gaps, slippage can swing the profitability of an entire trade. A backtest that doesn't model this, or models it as a flat figure. This makes it look dramatically better than the actual live strategy during the exact moments that matter most: high-volatility sessions where volatility spikes, order flow dries up, and fills get worse.
This is the first reality check: subtract realistic round-trip costs from your average winning trade. If the math breaks down after that subtraction, you don't have an edge.
Most backtests assume perfect execution because they’re built on static charts. With FX Replay, you’re executing trades as price unfolds, not placing entries on a finished chart. That difference exposes timing issues, missed fills, and hesitation that a standard backtest never captures.
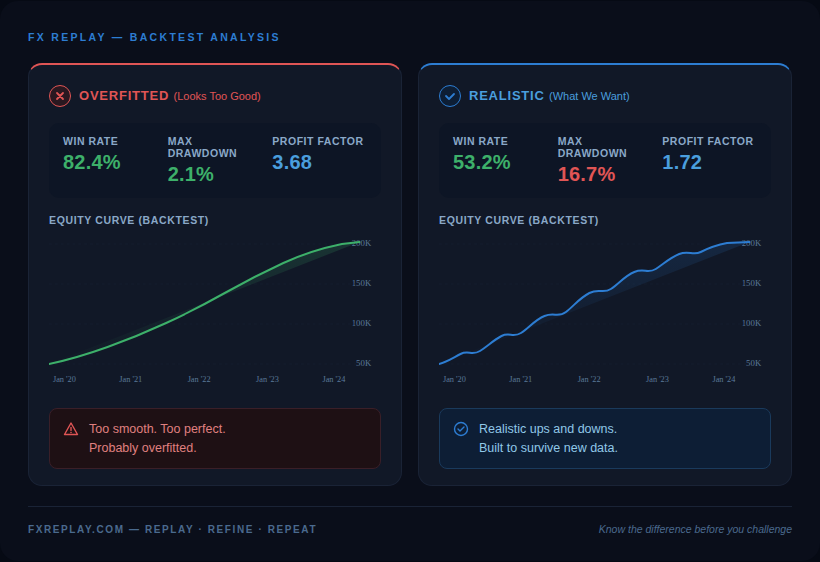
You've probably seen it. A strategy with a 80%+ win rate, smooth equity curve, drawdowns that look trivial. Everything inside you says: this is too perfect.
You're right. It probably is.
Overfitting happens when a strategy's rules get tightened, adjusted, or cherry-picked until they fit the historical data extremely well. The problem is they're fitting to noise, not to actual market patterns. This works beautifully in a backtest because the backtest only knows about the past, but the moment the strategy encounters new market data (which is literally every trade once you go live), it breaks.
Here's how to spot it:
An overfitted strategy typically shows:
The guard against overfitting is simple but most traders skip it: Lock your rules completely and don't touch them afterwards. Then test those locked rules on a period of data you never looked at during development.
If the strategy collapses, it was fit to the past. If it holds reasonably well, you might actually have something. Even then, a clean backtest doesn’t guarantee clean execution. Running the same rules inside FX Replay often reveals friction that isn’t visible in historical results: late entries, skipped signals, and timing errors that only show up when decisions have to be made in real time.
A strategy backtested from 2020–2022 lived through one of the most unusual volatility regimes in recent history. A strategy backtested from 2016–2018 lived through a relatively benign, low-volatility trending environment.
Both backtests are "successful." Both are also potentially misleading.
Every strategy has a preferred market condition. Trend-following systems print money in strong directional markets and bleed out in choppy ranges. Mean-reversion systems thrive in stable ranges and get obliterated in momentum rallies. The backtest will look great or terrible depending almost entirely on which regime dominated your test period, and you have zero control over which regime shows up when you go live.
This means your backtest answered one question: "Did this strategy work during “this” specific market regime?" It never answered: "Will this strategy work during “every” regime I'll face live?"
The fix is simple but effective: test your strategy across three deliberately different market periods.
Pick your worst three months of performance from your backtest results. What market conditions defined those periods? Identify the opposite: a trending period, a ranging period, a high-volatility spike period. Run your locked rules through each one separately.
A strategy that holds up reasonably across all three has a much more credible foundation than one that only survived one regime.
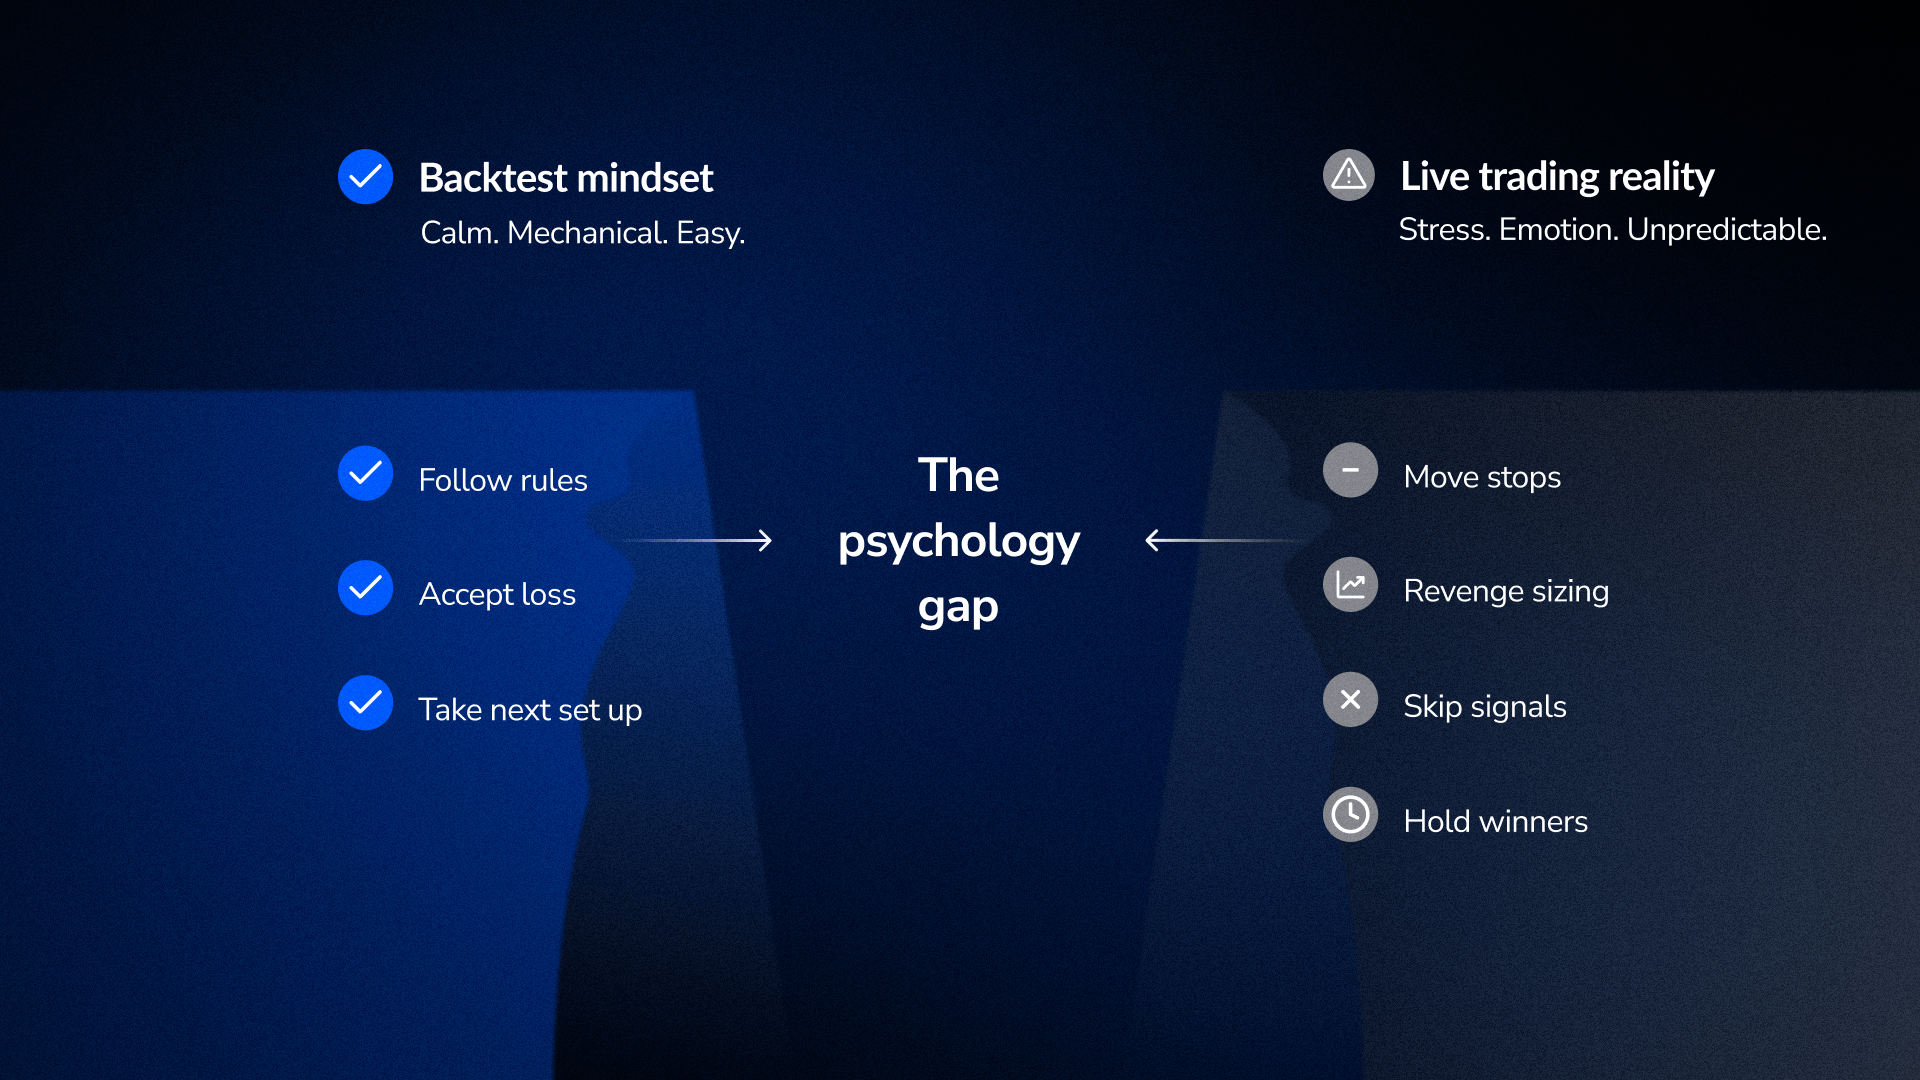
Here's what every trader discovers eventually: executing rules in a backtest and executing rules under real stress are two completely different activities.
In a backtest, you follow the rules. They're applied mechanically. A losing trade is a line on a chart. A drawdown is a number you review later.
In a live account with real capital, your body responds and the decision-making gets worse. That discipline you had when reviewing charts vanishes the moment price moves against you.
What happens next is predictable:
None of this is conscious weakness. It's a physiological response to conditions the backtest never created.
This is where the 10–20% degradation really comes from. Not from costs alone, but from the gap between mechanical rule-following and rule-following under stress.
Research on trading psychology shows that traders who experienced pressure during practice (not just reviewing charts, but actively making decisions as prices moved), performed significantly better in live trading than those who only reviewed static charts. This type of practice helps build neural pathways that align with the stress conditions of real trading.
This is exactly why replay-based practice works, and why FX Replay exists. You’re not reviewing what happened, but deciding what to do as it happens. The price is moving, you’re under time pressure, you experience a losing streak not as a number but as three losses in a row while you're still in the trade. That pressure, experience, and stress inoculation, actually transfers to live trading.
A static backtest tests one period. Walk-forward testing tests whether your strategy works as conditions shift, closer to actual live experience.
Your backtest shows one sequence of trades. Live trading is random. Monte Carlo shows the realistic worst-case range. A $5,000 backtest drawdown can become a $14,800 drawdown in the 95th percentile. If that would break your account psychologically, you're undersized.
Most traders track P&L during their forward test period. What they should track is rule adherence. A forward test where you took every valid signal and avoided every invalid signal is more informative than a profitable forward test where you only took the highest-conviction trades.
Most traders jump from backtest to live in one leap.
Backtest looks good → confidence builds → allocate capital.
What's missing is the stage in between, and that missing stage is where most strategies die.
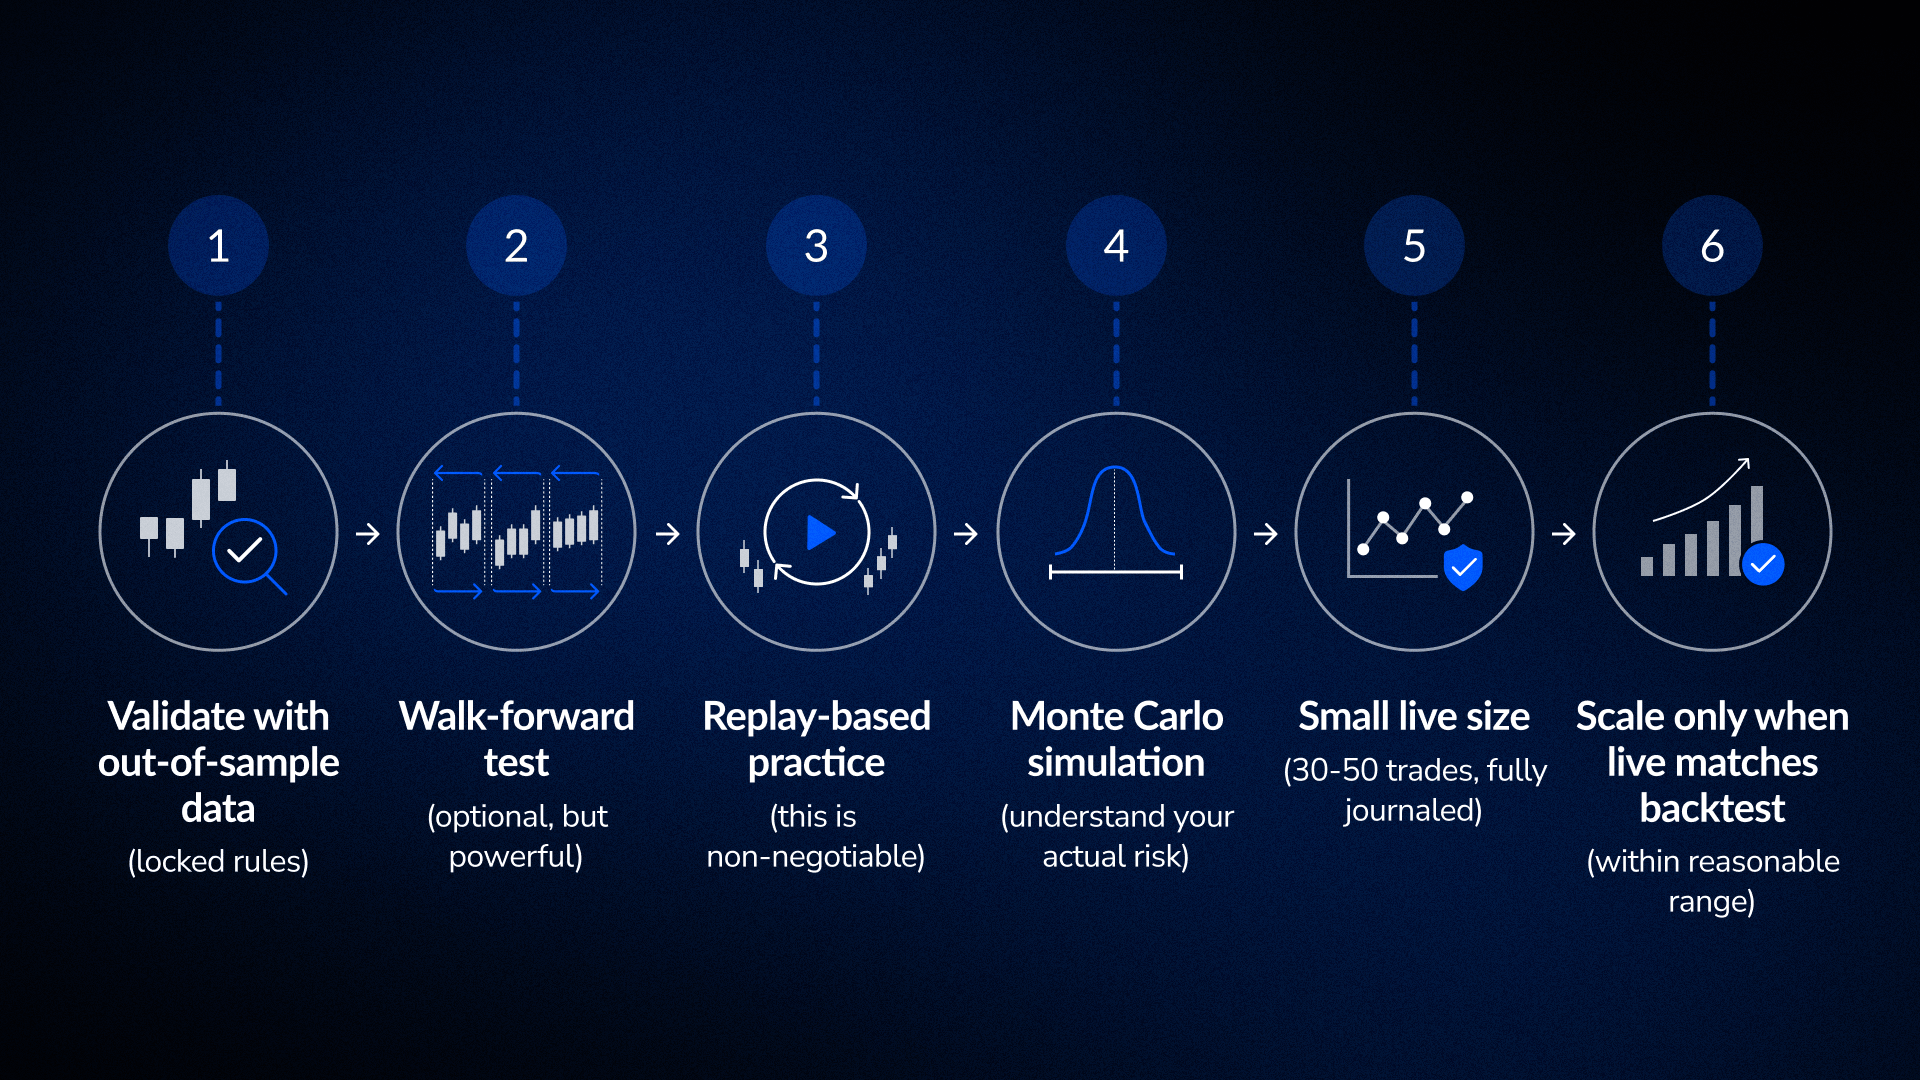
The sequence that actually works:
Test your strategy on data it never saw during development. If it holds up, move to step 2. If it collapses, you were overfitting. Go back and rebuild.
Re-test your strategy across rolling time windows, not just one static period. This mimics how conditions actually shift over time in live trading. If it holds up across multiple periods, the edge is more robust.
Practice your execution on real historical market conditions using a replay tool, just like FX Replay. Don't just review the chart, actively make entry and exit decisions as candles form. Journal your rule adherence separately from your P&L. Did you take every valid signal? Did you avoid every invalid signal? That matters more than whether you made money.
Shuffle the order of your historical trades 1,000+ times. This shows you the realistic distribution of possible drawdowns, not just the maximum drawdown your backtest happened to see.
Go live at a size small enough that losses don't hurt your judgment. Log every trade: entry rationale, execution, exit, what you felt, whether you followed the rules, etc. Compare this live data to your backtest expectations. Within 30–50 trades, you'll know if execution is matching the backtest or if something is degrading.
After 30–50 trades, you have real data. If live P&L is within 10–15% of backtest expectations and rule adherence is strong, the transition is working. Scale gradually from there.
Before moving any strategy to live trading, validate this:
Cost structure
Overfitting guard
Regime testing
Psychology and execution
The gap between backtest and live trading is not a failure of backtesting. It is a feature that shows backtesting is a filter, not a guarantee.
A good backtest tells you the strategy could work. It does not tell you the strategy will work in live conditions.
If you understand each component of the gap, including costs, overfitting, regime risk, and psychology, and validate each one before going live, you eliminate most of the uncertainty. The 10–20% degradation is no longer random. It becomes predictable, manageable, and something you have already accounted for.
The traders who make the transition successfully are not the ones with perfect backtests. They are the ones who did the validation work and understood exactly what their backtest was telling them.
Couldn't find your question here?
Go check out our Help Center below!
Usually one or more of these: costs weren't modeled realistically, the strategy was overfitted to historical data, market regime shifted to something the backtest never saw, or rule adherence degraded under real stress. Most of the time it's a combination.
Yes. It's typical for well-validated strategies. Strategies with unrealistic assumptions degrade much more. If your live P&L is within 10–20% of backtest expectations after 30–50 trades, the transition is working.
Test your locked rules on data you never used during development. If performance collapses, you were overfitting. If it holds reasonably well, you're probably okay.
It matters more than most traders realize. A static backtest over three years tells you one story. Walk-forward testing tells you whether that story holds across multiple sub-periods, which is closer to live conditions where market regimes constantly shift.
When your out-of-sample backtest holds up, replay practice shows consistent rule adherence, Monte Carlo analysis reveals acceptable risk, and your first 30 live trades match backtest expectations within a reasonable range.
.png)
.png)


