Trader Kane's NQ Strategy | The Lab Model

Intraday NQ strategy built on premium & discount, SMT divergence, and iFVGs to identify likely reversals or continuations depending on price action.

Trader Kane’s NQ Strategy, the Lab Model, is a structured reversal and continuation framework built around multi-timeframe range analysis on NQ, Nasdaq-100 futures, using ES as a correlated asset for SMT divergence confirmation. The central idea is that price is always either balanced or imbalanced relative to recent highs and lows, and that this state, tracked across the 4-hour, 1-hour, and 5-minute charts, tells you where price is likely to go next. The best trading window is 10am-1pm ET, with entries executed on the 1, 3, or 5-minute chart depending on where a clean Inverse Fair Value Gap, iFVG, presents itself.

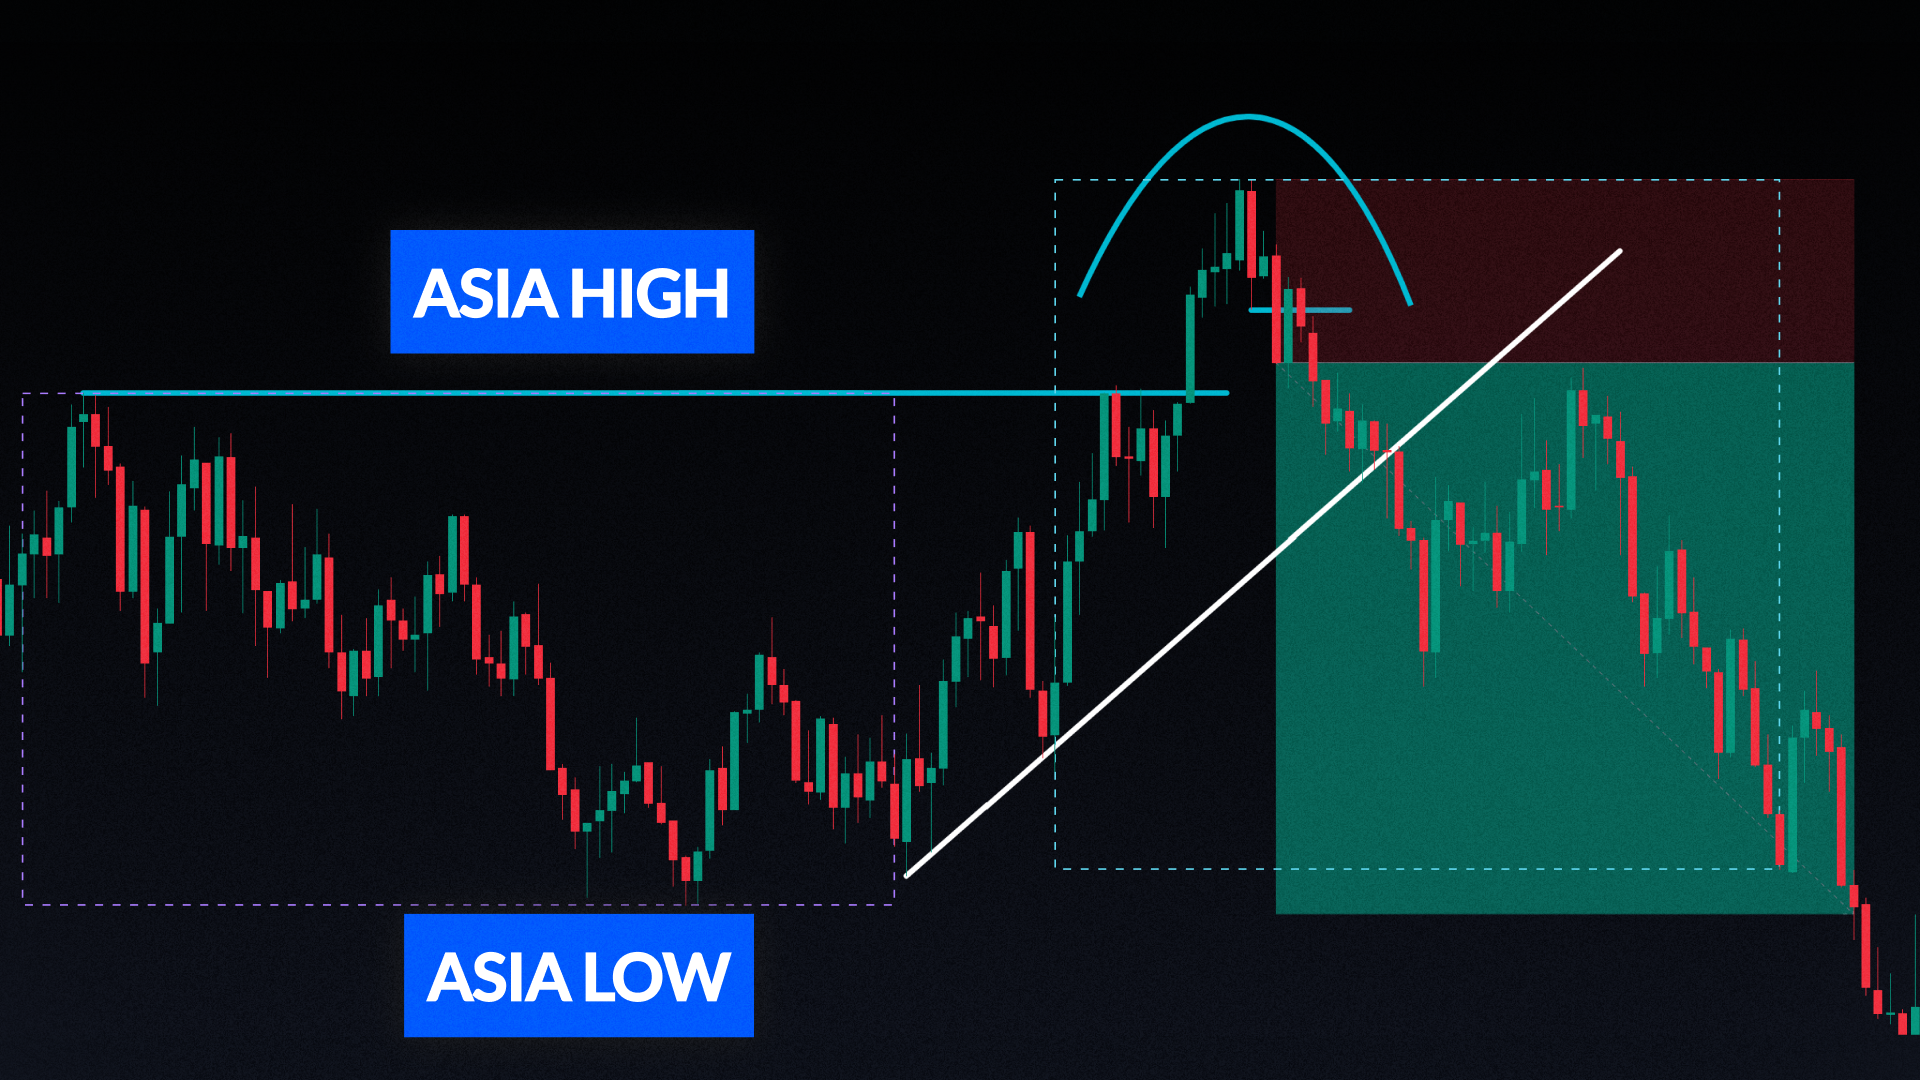
Two distinct setups are available. The reversal trade waits for the 10am 4-hour candle to close, then looks for a sweep of that candle’s high or low, confirmed by SMT divergence between ES and NQ and an iFVG on the lower timeframe. The continuation trade applies when a lower timeframe range has balanced while a higher timeframe imbalance still exists in the same direction, again confirmed by SMT and an iFVG. In both cases, the stop is placed at the recent high or low, the target is the Logical Liquidity Target, LLT, and breakeven is set mechanically once price reaches the halfway point to the take profit.

How the strategy works

Key concepts

Concept Description
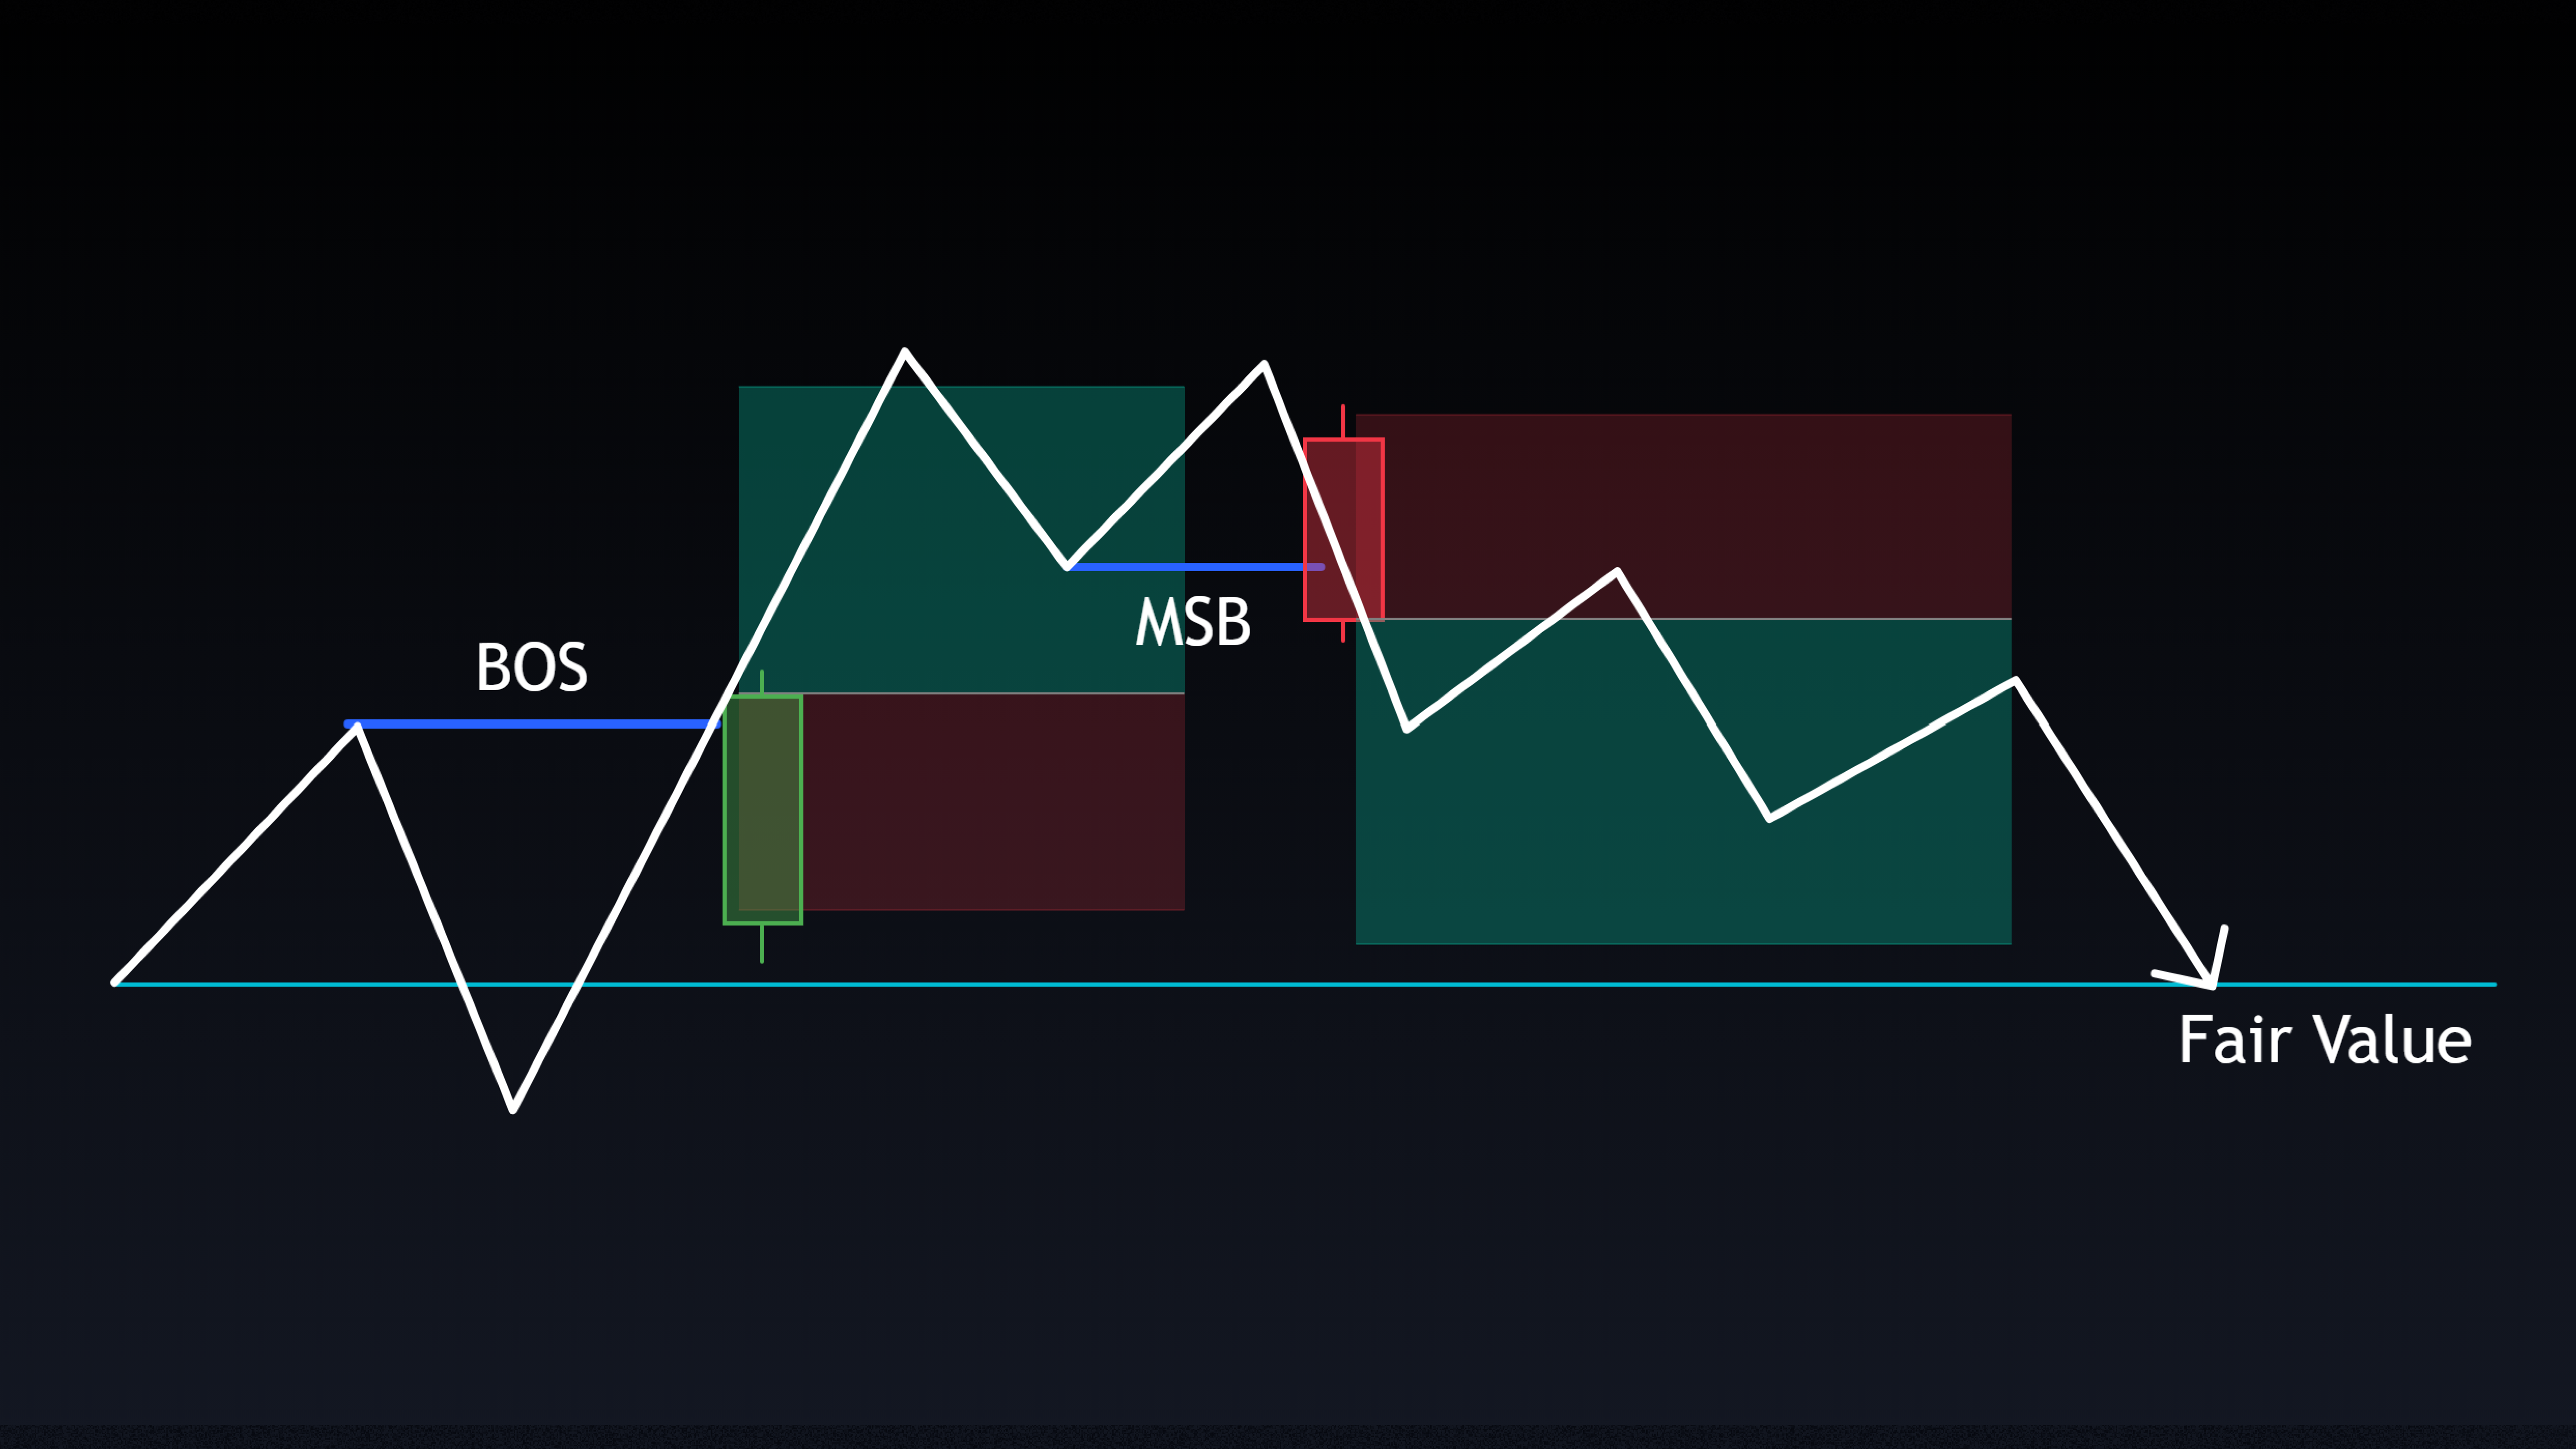
Premium / Discount & Balanced vs. Imbalanced The premium zone is the upper half of a recent price leg; the discount zone is the lower half. When price has retraced back to the midpoint of a range, that range is considered balanced. If it has not yet retraced, it is imbalanced, and the expectation is that it will balance in the future. Tracking balanced and imbalanced ranges across the 4hr, 1hr, and 5m timeframes is the foundation of the strategy’s bias framework.
Logical Liquidity Target, LLT The first high or low that price creates after crossing through the premium/discount midpoint. The LLT is used as the take profit target for both reversal and continuation trades, as it represents a natural resting point for price after a rebalancing move.
SMT Divergence A “crack in correlation” between two highly correlated assets, in this strategy, ES and NQ. When one sweeps a high or low and the other does not confirm it, the divergence signals a likely reversal. SMT is a required confirmation alongside the iFVG for both entry triggers.
Inverse Fair Value Gap, iFVG A Fair Value Gap, three-candle imbalance, where a subsequent candle closes through it, inverting it into a support or resistance zone. The iFVG acts as the precise entry level. Price is expected to return to and react from the inverted gap before continuing in the trade direction.

Entry triggers

Two setups are available depending on whether the trade is a reversal or a continuation. Both require SMT divergence and an iFVG on the 1, 3, or 5-minute chart as confirmation.

Trigger #1: Reversal

  • Identify HTF zones that need to re-balance.
  • Wait for the 10am ET 4hr candle to close.
  • ES or NQ sweeps the 4hr candle high or low away from the trade direction.
  • SMT divergence and iFVG appear on the 1, 3, or 5-minute chart for entry.
  • Stop at recent high or low.
  • Target the LLT.
  • Move to breakeven once price reaches halfway to take profit.

Trigger #2: Continuation

  • LTF range is balanced.
  • HTF imbalance remains in the same direction.
  • Trade targets the HTF imbalance.
  • SMT divergence and iFVG appear on the 1, 3, or 5-minute chart for entry.
  • Stop at recent high or low.
  • Target the LLT or new high or low.
  • Move to breakeven once price reaches halfway to take profit.

Trade checklists

Reversal

  • HTF zones identified that need to re-balance on the 4hr, 1hr, and/or 5m chart.
  • 10am ET 4hr candle has closed. Wait for ES or NQ to sweep the candle’s high or low away from the desired trade direction.
  • SMT divergence confirmed between ES and NQ at the swept level.
  • iFVG present on the 1, 3, or 5-minute chart.
  • Enter at the iFVG.
  • Stop at recent high or low.
  • Target LLT.
  • Move to breakeven at halfway to take profit.

Continuation

  • LTF range is balanced.
  • HTF imbalance still exists in the same trade direction.
  • Trade targets that imbalance.
  • SMT divergence confirmed between ES and NQ.
  • iFVG present on the 1, 3, or 5-minute chart.
  • Enter at the iFVG.
  • Stop at recent high or low.
  • Target LLT or new high or low.
  • Move to breakeven at halfway to take profit.

If any parameters are missing, trade quality is reduced. Aim to take only A+ setups. If SMT occurs first, consider a buy or sell stop if price is moving strongly toward the iFVG inversion. If SMT occurs second, earlier iFVGs can be re-used as the entry level.
Watch & Learn

Get PDF
Table of contents

Have questions?
We’ve got answers.

Couldn't find your question here?
Go check out our Help Center below!

Help center

Why is the 10am ET 4-hour candle specifically the reference point for reversals?

The 10am ET 4-hour candle is significant because it coincides with the opening of the primary NY trading window and often sets the session's directional high or low. By waiting for this candle to close before looking for a sweep, the strategy avoids acting on noise from the pre-market and early open. The sweep of that candle's high or low, particularly with SMT confirming that at least one of ES or NQ made a false move, is a reliable signal that the real directional move is about to begin.

How do I track balanced and imbalanced ranges across multiple timeframes?

The key is to mark the premium/discount zones on the 4hr, 1hr, and 5m charts simultaneously and note which ones have retraced to their midpoint, balanced, and which have not, imbalanced. When a lower timeframe range balances while a higher timeframe range remains imbalanced in the same direction, that is the condition for a continuation trade. FX Replay's multi-timeframe replay environment makes it straightforward to practice this markup process across all three timeframes on the same session.

How do I get started backtesting this strategy on FX Replay?

The best way to get started is with FX Replay's 5-day free trial of the Pro plan, which gives you full access to the asset library and advanced backtesting and analytics features from day one. After signing up, you can load a session, select your instrument and date range, and start replaying price action bar by bar. The platform includes built-in trade logging, session statistics, and a journal so your results are tracked automatically as you go. Visit the Getting Started section of the FX Replay Help Center for step-by-step guides.

What is the difference between the reversal and continuation setups?

The reversal setup looks for price to sweep a key level in the opposite direction of your trade, then snap back, confirmed by SMT and an iFVG. The continuation setup is used when a lower timeframe range has already balanced, retraced to its midpoint, while a higher timeframe imbalance still exists in the same direction. In this case, the LTF re-balance acts as the pullback, and the trade continues toward the unresolved HTF target. Both require SMT and an iFVG for the actual entry.

Tori Trades Trend Line Strategy

By

Tori Trades

Swing off 4h trend line breaks with clean spacing and structure. TP at S/R for 2R+. Uses alerts to time entries.
Easy
Swing
Asia
London
New York
Indexes
Metals
ICT Unicorn Strategy

By

ICT

Catch clean reversals using liquidity, breakers, and FVGs for simple, high-probability 2R setups.
Intermediate
Intraday
London
New York
Indexes
Metals