Tomtrades CBR model

Gold reversal strategy using 1-minute MSBs, session timing, and DXY confluence to capture high-probability intraday trades.

Tomtrades 1hr/1m Model: CBR Simplified

The Tomtrades 1hr/1m Model, CBR Simplified, is a reversal strategy designed around a specific market behaviour in gold, XAUUSD: when price over-extends in one direction during the Asia session, it often needs to reverse and rebalance. The strategy uses the 1-hour chart to establish directional bias using gold and DXY price action, then drops to the 1-minute chart to time entries during the second hour of the Asia session, the window where these reversals most consistently occur.

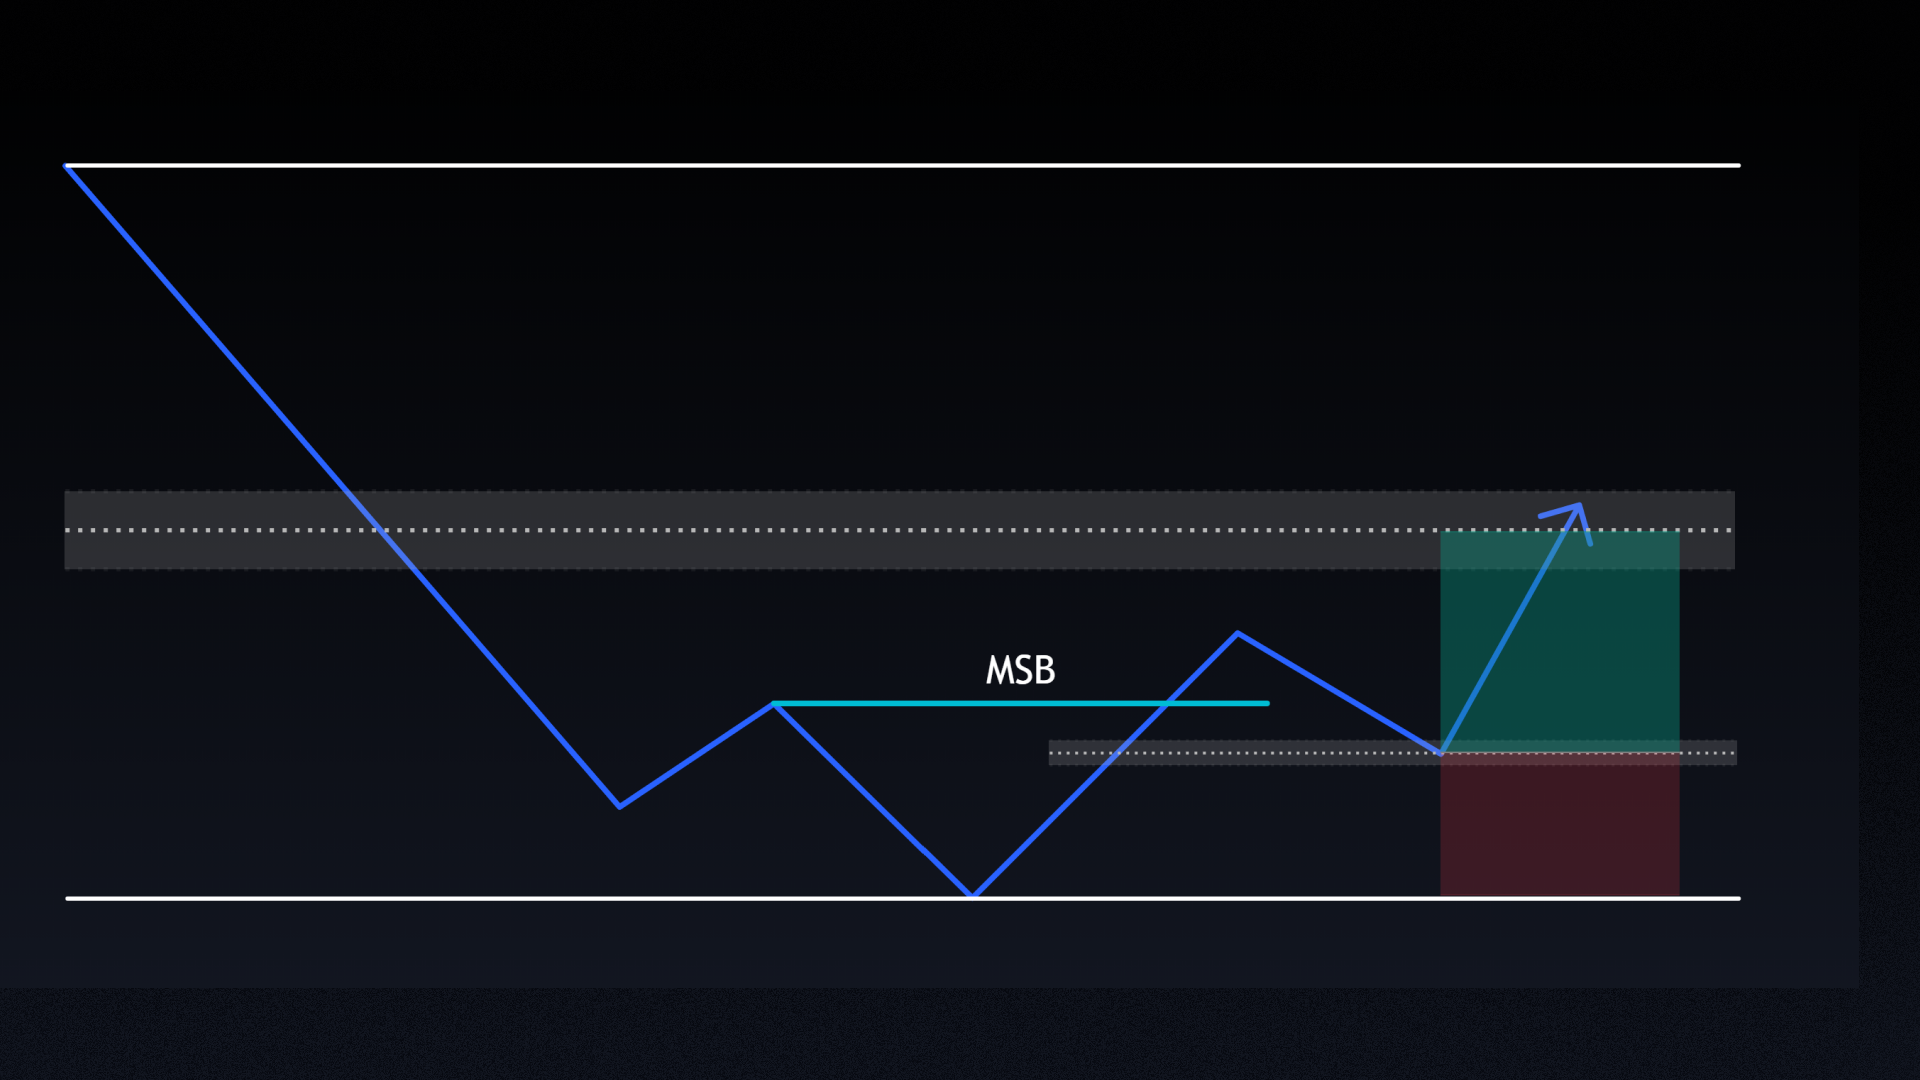
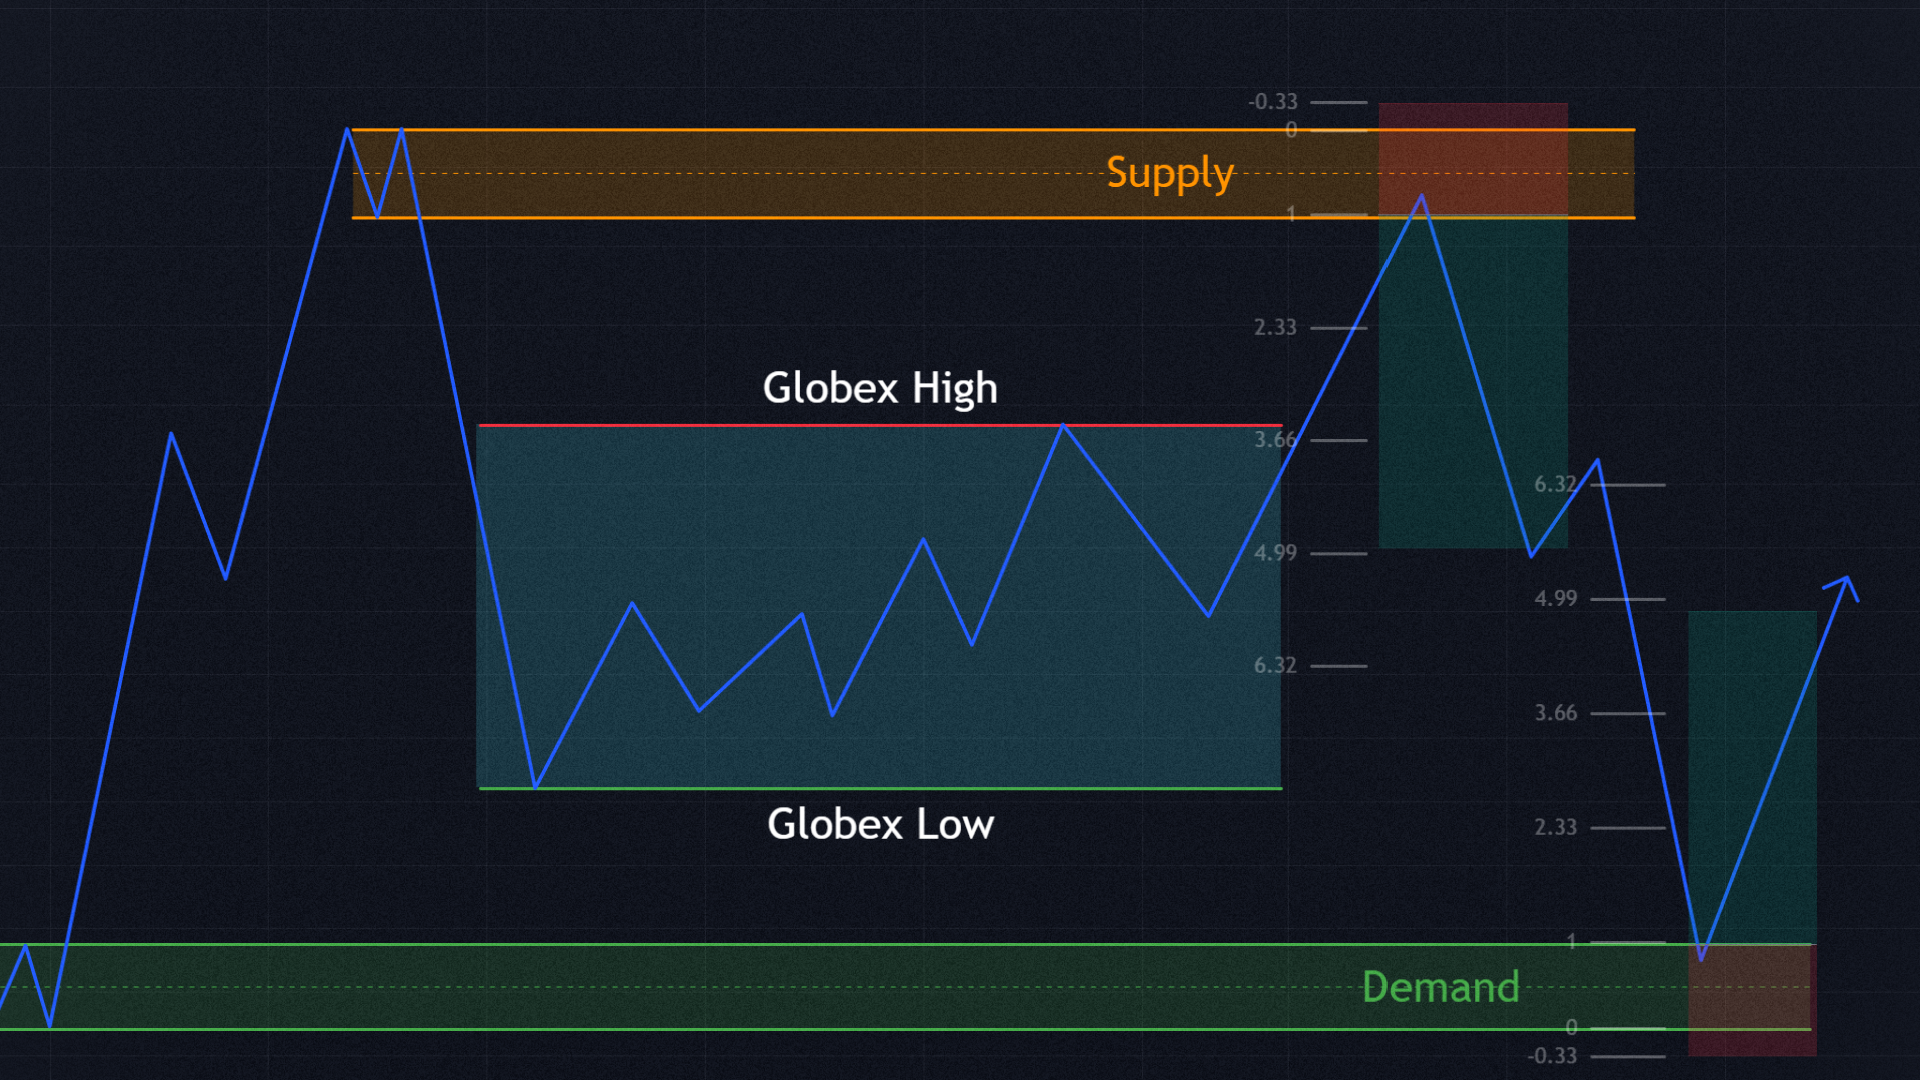
The core entry trigger is a “Type 3 shift”, a specific market structure break on the 1-minute chart that follows a liquidity sweep of the first Asia session’s high or low, or a rebalancing of a recent trending range. Entries are taken at a 50% pullback of the MSB move, with the stop at the recent structural high or low, and the take profit targeting either the 50% equilibrium of the over-extension move or a fixed 1.5R. The strategy is deliberately disciplined: a maximum of two attempts per session, and done for the day after one winning trade.

How the strategy works

Key concepts

Concept Description
Candle Behaviour Reversal, CBR When price is trending bullish, higher timeframe candles often open bearishly to form a bottom wick before closing bullish. Those bottom wicks represent the best entry opportunities for long reversals. The inverse applies in bearish trends. This is the foundational principle behind the model.
Market Structure Break, MSB, Type 3 Shift A candle that closes past the wick high or low of a recent price leg, signalling a potential trend reversal. For this model, the MSB must be preceded by price taking out local structure first, for example, making a lower low before creating the bullish MSB. This specific sequence is what qualifies it as a valid “Type 3 shift.”
DXY Correlation Gold and the US Dollar Index, DXY, typically move inversely. If gold is moving up while DXY is moving down, that is a bullish bias confirmation. If both are moving in the same direction, the setup is lower probability and is best skipped.
Over-extension Price expanding away from your bias direction for at least 20 minutes without substantial pullbacks. This creates the conditions for a rebalance back to the 50% Fibonacci level of that extension move, the target for the take profit.
PO3 Indicator Used to display the last two 30-minute candles with a 5 offset. This helps identify the 30-minute candle sweep that serves as an added confirmation when it occurs 30 minutes or more into the second hour of the Asia session.

Trade checklist

  • Bullish or bearish bias confirmed using 1-hour gold and DXY price action, with both moving in opposite directions.
  • At least 20 minutes of price expanding away from the desired trade direction without meaningful pullbacks.
  • 1-hour candle high or low sweep, or a range rebalance, followed by a valid 1-minute Type 3 MSB.
  • Entry at approximately 50% retracement of the MSB move.
  • Stop loss at the recent structural high or low.
  • Take profit at 50% of the over-extension or fixed 1.5R.

Maximum 2 attempts per session. Stop trading for the day after one winning trade. Approximately 30% of valid setups will not offer a pullback entry. This is expected and should be accepted.

Watch & Learn

Get PDF
Table of contents

Have questions?
We’ve got answers.

Couldn't find your question here?
Go check out our Help Center below!

Help center

What makes the second hour of the Asia session the best window to trade this?

After journaling hundreds of trades taken in Asia session, Tom identified the 2nd hour to be the most likely window for reversals. The first hour of the Asia session often establishes the initial range, setting a high and a low that become the liquidity targets. The second hour is when price most frequently sweeps those levels and reverses, creating the over-extension and subsequent rebalance that the strategy is built around. Trading outside this window is possible but reduces the probability of the setup forming cleanly.

What should I do if gold and DXY are moving in the same direction?

Skip the session. When the inverse correlation between gold and DXY breaks down, the directional bias is unclear and the setup is considered lower probability. The strategy explicitly recommends avoiding trades under these conditions rather than forcing a directional call.

Why does the MSB need a prior local structure break to be valid?

A standard MSB on its own can occur during normal market noise. The Type 3 shift requires price to first take out local structure in the opposite direction, for example, making a lower low before the bullish MSB forms. This extra step confirms that a genuine liquidity sweep has occurred and increases the likelihood that the subsequent reversal has real follow-through rather than being a false signal.

How do I get started backtesting this strategy on FX Replay?

The best way to get started is with FX Replay's 5-day free trial of the Pro plan, which gives you full access to the asset library and advanced backtesting and analytics features from day one. After signing up, you can load a session, select your instrument and date range, and start replaying price action bar by bar. The platform includes built-in trade logging, session statistics, and a journal so your results are tracked automatically as you go. Visit the Getting Started section of the FX Replay Help Center for step-by-step guides.

Mayne's Monday Ranges

By

Trader Mayne

Trade mean reversions around Monday’s range with clean 1hr reclaims or sweeps—simple, weekly setups with high-timeframe alignment.
Intermediate
Swing
Asia
London
New York
Crypto
ICT AMD PO3 Strategy

By

ICT

Trade powerful breakouts with this 3-phase strategy—spot accumulation, catch the manipulation, and ride the expansion for high-R moves.
Intermediate
Intraday
New York
Indexes
Metals
Crypto