ICT AMD PO3 Strategy

Trade powerful breakouts with this 3-phase strategy—spot accumulation, catch the manipulation, and ride the expansion for high-R moves.

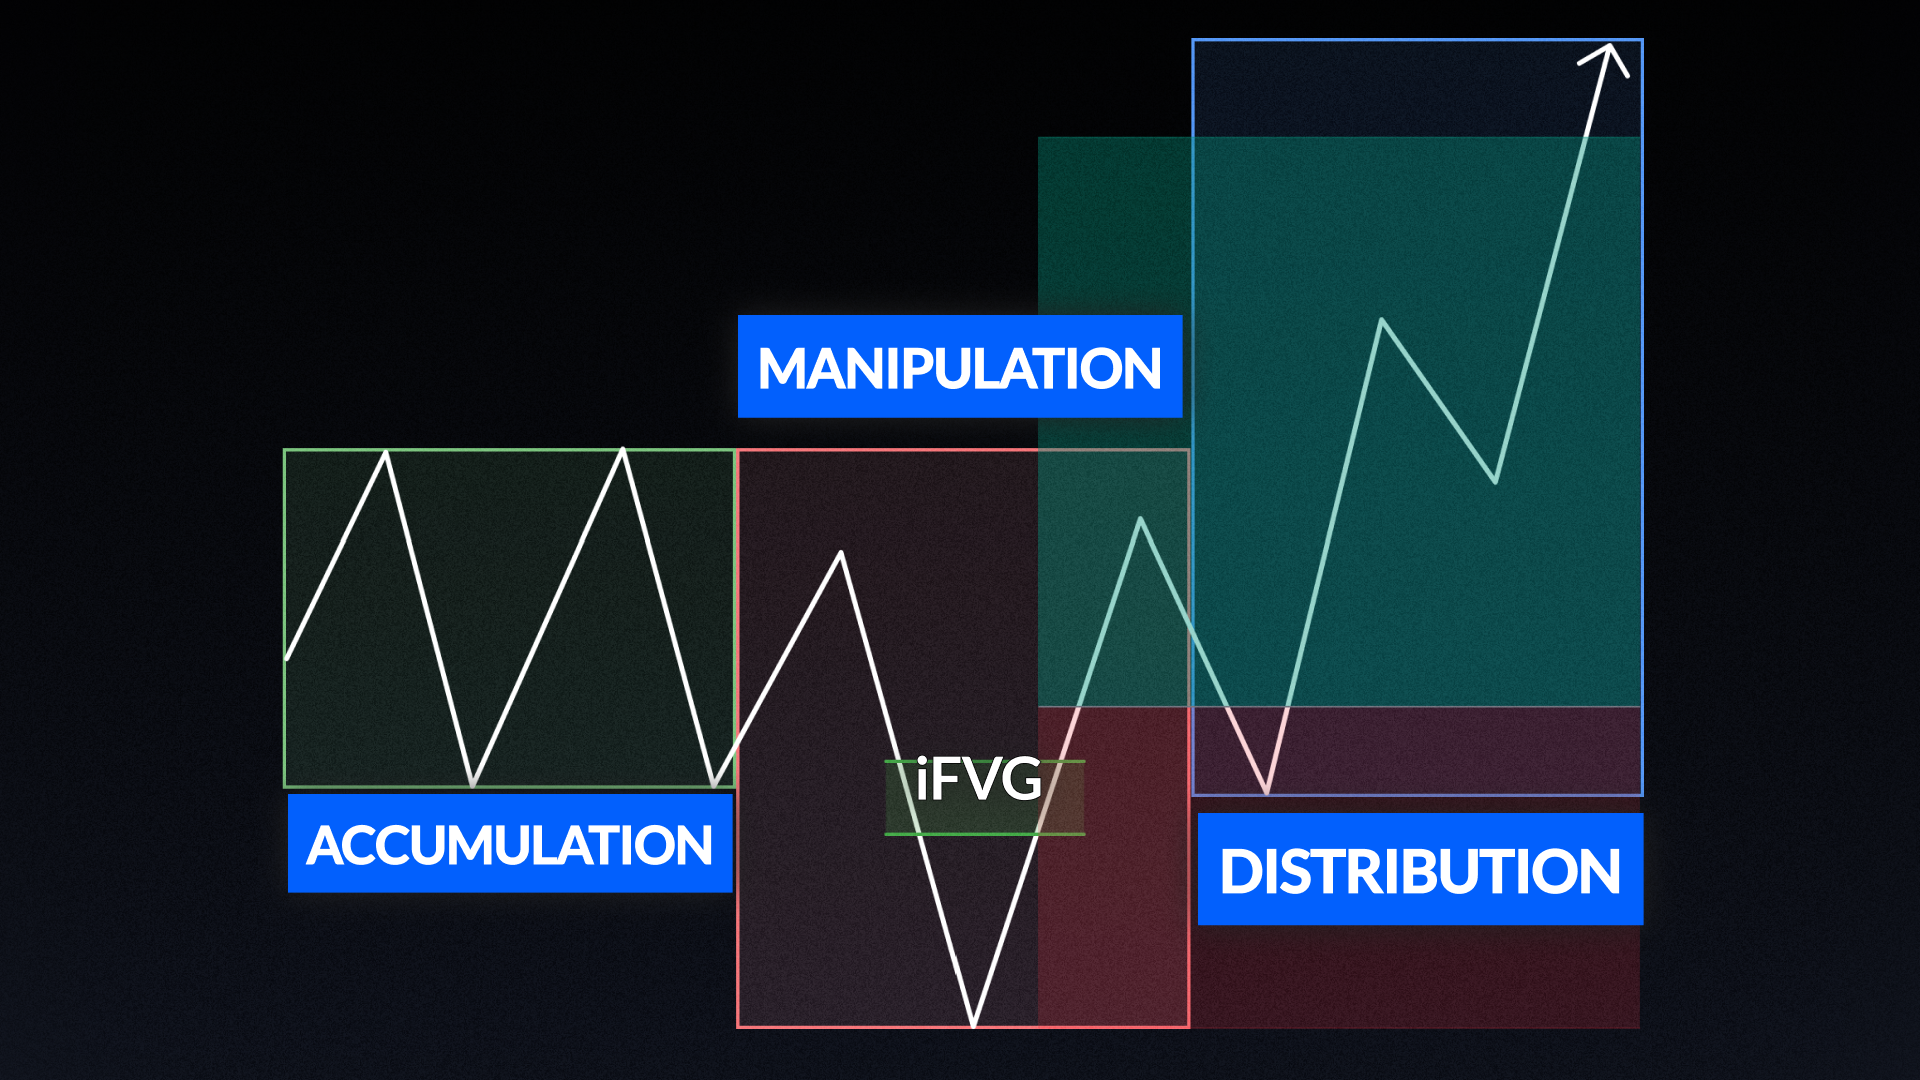
ICT’s AMD / Power of Three, PO3, Model is a price delivery framework that describes how markets move in three distinct, repeatable phases: Accumulation, Manipulation, and Distribution. Originally a concept from ICT, Inner Circle Trader, it recognises that price rarely moves in a straight line. Instead, it consolidates, engineers a false move to trap participants on the wrong side, then delivers the true directional move. The strategy is traded on the 1-minute chart on NQ during the NY session, though the model can be applied across other timeframes and between sessions.

The key insight is in the manipulation phase: rather than trying to identify every accumulation zone, the focus is on spotting a sharp move out of and back into the accumulation range. This is the manipulation. Once identified, two entry methods are available: an Inverse Fair Value Gap, iFVG, retest formed during the manipulation leg, or a retest of the manipulation box boundary when no iFVG is present. Both entries target 2 standard deviations of the manipulation leg as the primary take profit, scaling to 4 standard deviations when the 2 STDV target does not offer at least 2R.

How the strategy works

The three phases

Accumulation

A period of consolidation where price ranges without a clear direction. Use candle bodies, not wicks, to define the accumulation zone boundaries.

Manipulation

A sharp, decisive move out of the accumulation range that quickly reverses back into it. This is the engineered false move designed to trap breakout traders on the wrong side.

Distribution

The true directional move. Price breaks out of the accumulation in the opposite direction of the manipulation and delivers to the target, typically 2-4 standard deviations from the manipulation leg.

Measuring the distribution target

Apply the Fibonacci retracement tool to the manipulation leg. Set levels at 0, 2, and 4. The 2 STDV level is the primary target. If it does not offer at least 2R from the entry, use the 4 STDV level as the target instead.

Entry triggers

After the manipulation phase is identified and price closes back into the accumulation zone, watch for one of two entries on the distribution leg.

Trigger #1: iFVG Retest

  • A Fair Value Gap forms during the manipulation leg.
  • A subsequent candle closes through the FVG, inverting it.
  • Enter on the retest of the iFVG.
  • Stop loss at the manipulation high or low.
  • Target 2 STDV, or 4 STDV if 2 STDV does not offer 2R+.

Trigger #2: Box Setup

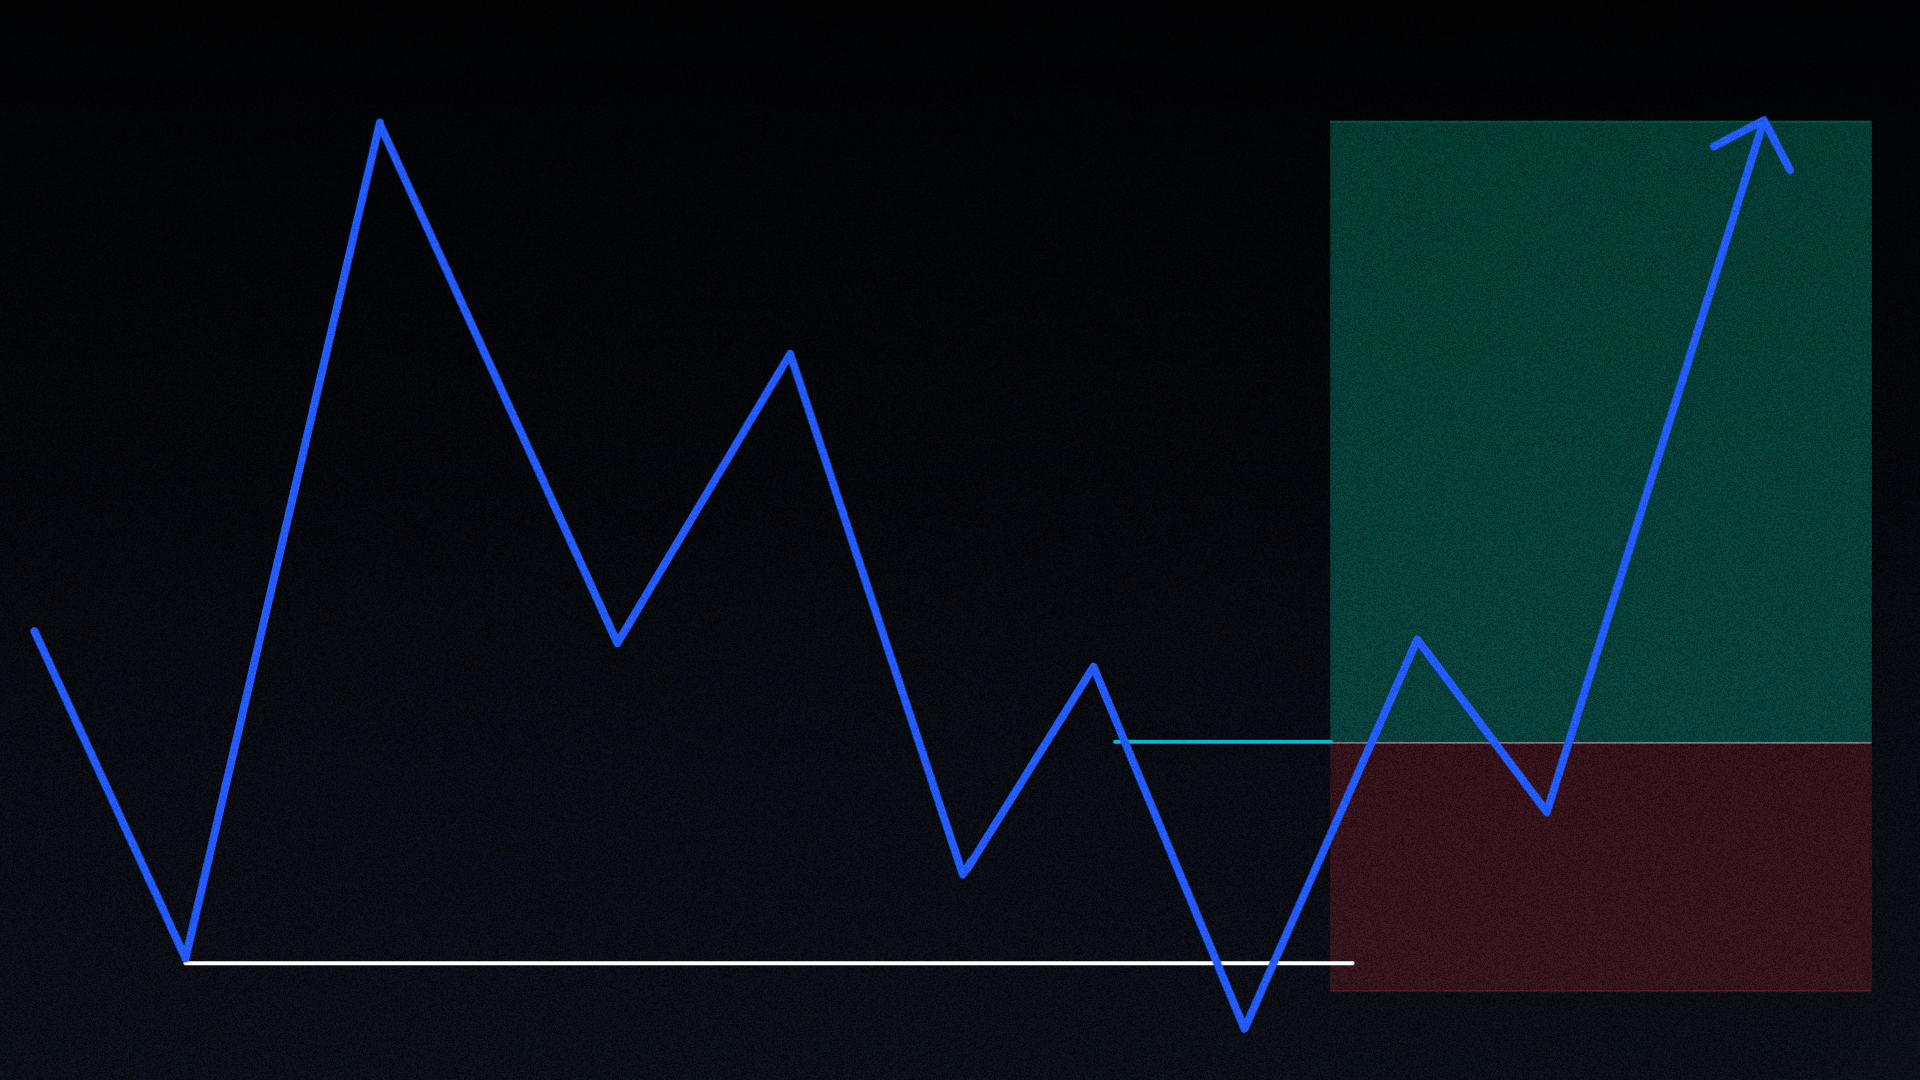
  • No valid iFVG is present from the manipulation leg.
  • Price closes back into the accumulation zone.
  • Enter on a retest of the manipulation box boundary, high for longs or low for shorts.
  • Stop loss at the manipulation high or low.
  • Target 2 STDV, or 4 STDV if 2 STDV does not offer 2R+.

Trade checklist

  • Accumulation zone identified using candle bodies, with a clear consolidation range and defined highs and lows.
  • Manipulation phase confirmed, with a sharp move out of and back into the accumulation zone, not a gradual drift.
  • Entry trigger selected: iFVG retest from the manipulation leg, Trigger #1, or manipulation box boundary retest, Trigger #2, if no iFVG is present.
  • Stop loss placed at the manipulation high or low.
  • Take profit set at 2 STDV of the manipulation leg if it provides 2R+. If not, target 4 STDV instead.

If any parameters are missing, trade quality is reduced. Aim for A+ setups only.

Watch & Learn

Get PDF
Table of contents

Have questions?
We’ve got answers.

Couldn't find your question here?
Go check out our Help Center below!

Help center

Can the AMD model be applied to timeframes other than the 1-minute chart?

Yes, the AMD / Power of Three model is fractal by nature and applies across all timeframes. The PDF notes it can be used on other timeframes or to describe AMD patterns that play out between sessions, for example, the Asia session acting as Accumulation, London as Manipulation, and New York as Distribution. Scaling to higher timeframes like the 15m or 1hr chart allows for wider targets and a different pace, while the core entry logic remains the same.

How do I distinguish a genuine manipulation phase from normal market noise?

The key characteristic of a manipulation move is that it is sharp and quickly reversed. It moves decisively outside the accumulation range and then closes back inside it within a short period. Normal noise tends to be choppy without a clear directional push and return. Additionally, a valid manipulation is often accompanied by a liquidity sweep of a meaningful level, such as a session high or low, or a prior day high or low, which confirms that the move was engineered to collect stop orders before the real move begins.

When should I use Trigger #1, iFVG, versus Trigger #2, Box Setup?

Trigger #1 is preferred whenever a valid iFVG is present from the manipulation leg, as it gives a more precise entry point with a tighter stop-to-entry distance. Trigger #2, the retest of the manipulation box boundary, is the fallback when no iFVG formed or when the FVG was not cleanly inverted. In both cases the stop and target logic are identical; the difference is purely in where the entry level sits.

How do I get started backtesting this strategy on FX Replay?

The best way to get started is with FX Replay's 5-day free trial of the Pro plan, which gives you full access to the asset library and advanced backtesting and analytics features from day one. After signing up, you can load a session, select your instrument and date range, and start replaying price action bar by bar. The platform includes built-in trade logging, session statistics, and a journal so your results are tracked automatically as you go. Visit the Getting Started section of the FX Replay Help Center for step-by-step guides.

Trader Kane's NQ Strategy | The Lab Model

By

Trader Kane

Intraday NQ strategy built on premium & discount, SMT divergence, and iFVGs to identify likely reversals or continuations depending on price action.
Intermediate
Intraday
New York
Indexes
Fibonacci Retracement Forex Swing Trading Strategy

By

Ara

Swing trading strategy combining EMAs, fractals, and Fibonacci retracements to identify high-probability forex setups.
Easy
Swing
Asia
London
New York
Forex